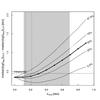
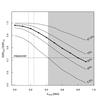
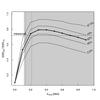
Fig. 8
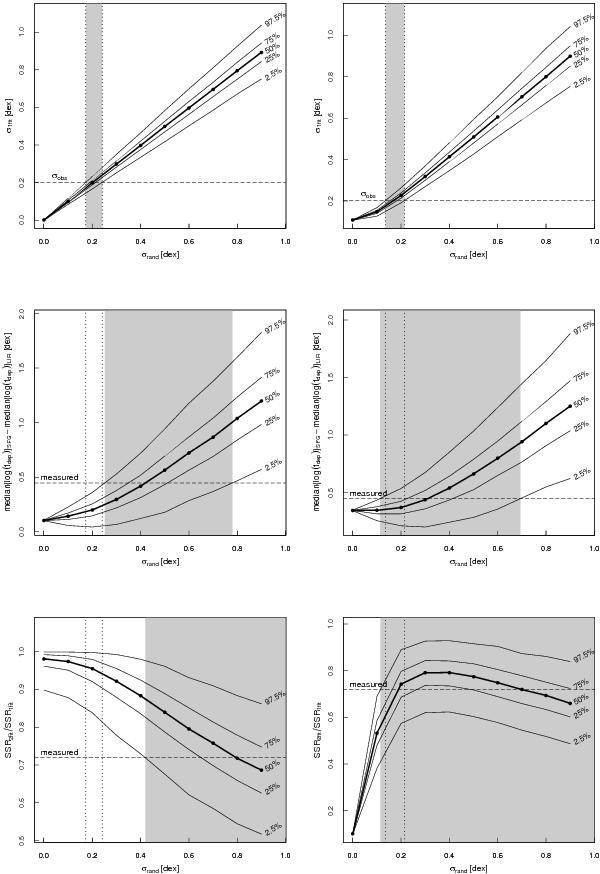
Results from testing the null hypotheses of a single KS law (left column) and of a double KS law (right column). Each panel shows the 2.5%,25%,50%,75% and 97.5% percentiles of σ1fit (top), Δlog (tdep) (middle) and SSR2fit/SSR1fit (bottom) as a function of σrand. The measured values are indicated by dashed horizontal lines. A gray rectangle represents the 95% confidence interval for σrand derived in each panel from the measured value. Dotted lines show the confidence intervals derived from σ1fit (top panels).
Current usage metrics show cumulative count of Article Views (full-text article views including HTML views, PDF and ePub downloads, according to the available data) and Abstracts Views on Vision4Press platform.
Data correspond to usage on the plateform after 2015. The current usage metrics is available 48-96 hours after online publication and is updated daily on week days.
Initial download of the metrics may take a while.