Fig. 1
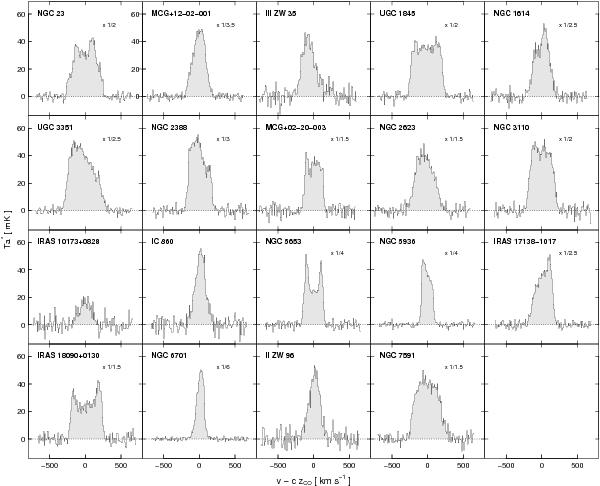
a) CO(1–0) spectra observed with the IRAM 30 m telescope in a sample of 19 LIRGs. Spectra appear from top to bottom and from left to right in order of increasing right ascension of the source. For clarity some of the line intensities were scaled by the factor indicated in the panel. Gray-filled histograms highlight the velocity range used to calculate the baseline fitting and the line areas.
Current usage metrics show cumulative count of Article Views (full-text article views including HTML views, PDF and ePub downloads, according to the available data) and Abstracts Views on Vision4Press platform.
Data correspond to usage on the plateform after 2015. The current usage metrics is available 48-96 hours after online publication and is updated daily on week days.
Initial download of the metrics may take a while.