Free Access
Fig. 9
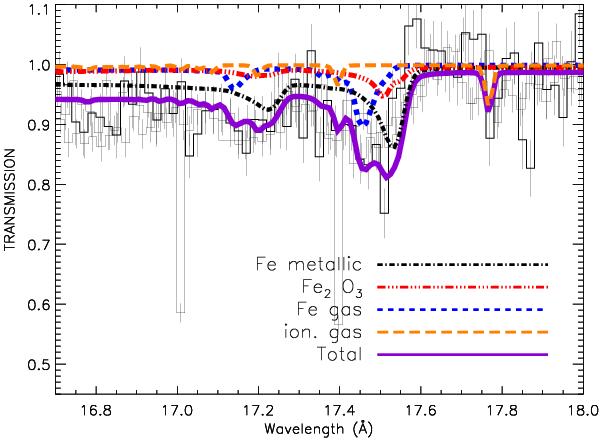
Best-fit transmission spectrum of the region around the iron LII and LIII edges. This allows us to compare absorption at different epochs, removing the contribution of the continuum. The upper curves display the transmission of the various absorbing components.
Current usage metrics show cumulative count of Article Views (full-text article views including HTML views, PDF and ePub downloads, according to the available data) and Abstracts Views on Vision4Press platform.
Data correspond to usage on the plateform after 2015. The current usage metrics is available 48-96 hours after online publication and is updated daily on week days.
Initial download of the metrics may take a while.