Fig. 6
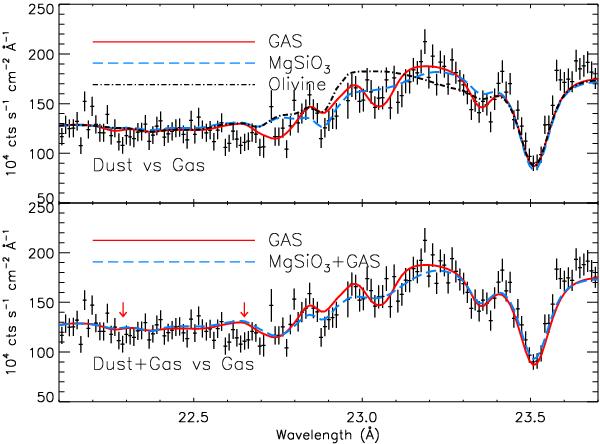
Fits in the oxygen region. Here only RGS1 of the most recent observation is displayed for clarity. Upper panel: comparison between a fit only in terms of gas (solid line) and the best fit obtained using dust (dashed line). For comparison an unacceptable fit using olivine (dashed-dotted line) is also displayed. Lower panel: comparison between a fit only in terms of gas (solid line) and the best fit obtained with a mixture of gas and dust (dashed line). See more details in the text.
Current usage metrics show cumulative count of Article Views (full-text article views including HTML views, PDF and ePub downloads, according to the available data) and Abstracts Views on Vision4Press platform.
Data correspond to usage on the plateform after 2015. The current usage metrics is available 48-96 hours after online publication and is updated daily on week days.
Initial download of the metrics may take a while.