Fig. 7
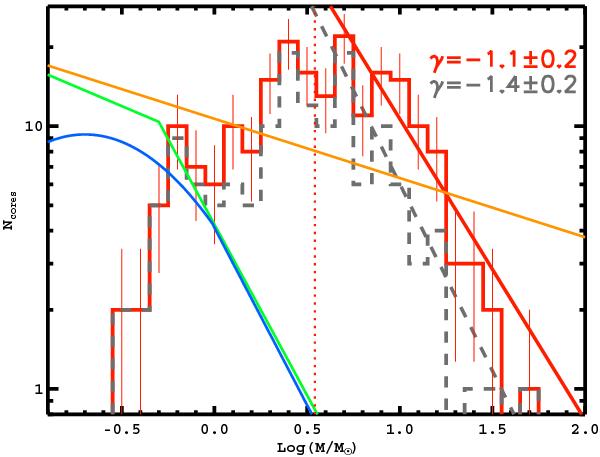
Source mass distribution in Vela-C. The error bars correspond to  statistical uncertainties. Continuous red line represents the fit to the linear portion of the mass distribution (namely that consistent with a single straight line within the errorbars) for all prestellar sources. A similar fit performed on the restricted sample of prestellar sources with diameters less than 0.08 pc is represented with a grey dashed line. The derived slopes are reported as well. Mass distribution of CO clumps (Kramer et al. 1998), the single-star IMF (Kroupa 2001) and the multiple-system IMF (Chabrier 2005) are shown for comparison with an orange, a green, and a blue line, respectively. The dotted vertical line represents the mass completeness limit of prestellar sources.
Current usage metrics show cumulative count of Article Views (full-text article views including HTML views, PDF and ePub downloads, according to the available data) and Abstracts Views on Vision4Press platform.
Data correspond to usage on the plateform after 2015. The current usage metrics is available 48-96 hours after online publication and is updated daily on week days.
Initial download of the metrics may take a while.