Fig. 6
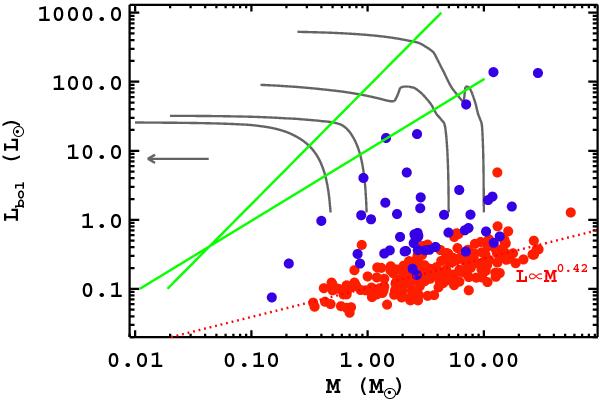
Lbol − M diagram for prestellar and protostellar sources in Vela-C (red and blue circles, respectively). Grey solid lines represent the evolutionary tracks for low-mass objects adopted by Molinari et al. (2008), for initial values of 0.5, 1, 5, and 10 M⊙, respectively. An arrow indicates the evolution direction, while green lines delimit the region of transition between Class 0 and Class I sources (André et al. 2000). The red dotted line represents the best-fitting power law (Lbol ∝ M0.42 ± 0.04) for the distribution of the prestellar sources.
Current usage metrics show cumulative count of Article Views (full-text article views including HTML views, PDF and ePub downloads, according to the available data) and Abstracts Views on Vision4Press platform.
Data correspond to usage on the plateform after 2015. The current usage metrics is available 48-96 hours after online publication and is updated daily on week days.
Initial download of the metrics may take a while.