Fig. 4
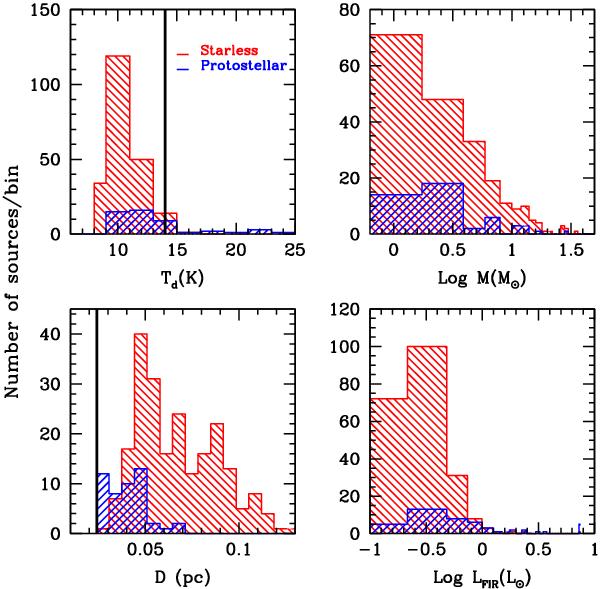
Histograms of the main physical parameters of the sources in Vela-C (top left: temperature; top right: mass; bottom left: diameter; bottom right: Herschel luminosity). Starless and protostellar sources are separately highlighted in red and blue, respectively. The black line in the top left panel represents the temperature of the surrounding cloud, taken from Hill et al. (2011), while that in the bottom left panel highlights the spatial resolution limit.
Current usage metrics show cumulative count of Article Views (full-text article views including HTML views, PDF and ePub downloads, according to the available data) and Abstracts Views on Vision4Press platform.
Data correspond to usage on the plateform after 2015. The current usage metrics is available 48-96 hours after online publication and is updated daily on week days.
Initial download of the metrics may take a while.