Fig. 7
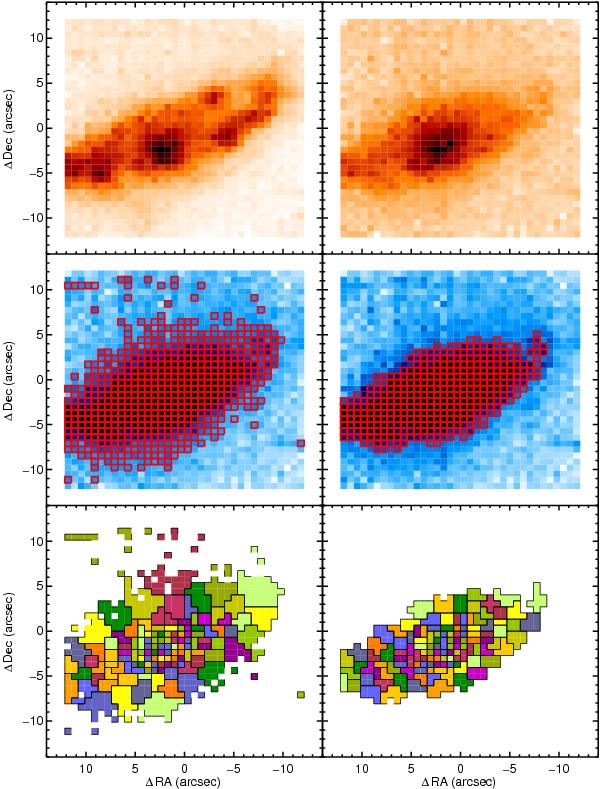
Comparison of the S/N optimization method with other techniques using the VLT-VIMOS observation of IRAS F10409-4556. Top-panels: Hα narrow-band (left) and V-band continuum (right) images showing the morphology of the galaxy. Middle-left panel: selected spaxels using a simple S/N threshold cut ( > 2) to the continuum at 5700 Å (100 Å width). Middle-right panel: selected spaxels applying the S/N optimization method in the continuum using the same parameters as in the S/N threshold case. Bottom-panels: Voronoi binning of the selected spaxels using the S/N threshold technique (left) and the S/N optimization (right), with a target minimum S/N within each bin of 5.
Current usage metrics show cumulative count of Article Views (full-text article views including HTML views, PDF and ePub downloads, according to the available data) and Abstracts Views on Vision4Press platform.
Data correspond to usage on the plateform after 2015. The current usage metrics is available 48-96 hours after online publication and is updated daily on week days.
Initial download of the metrics may take a while.