Fig. 6
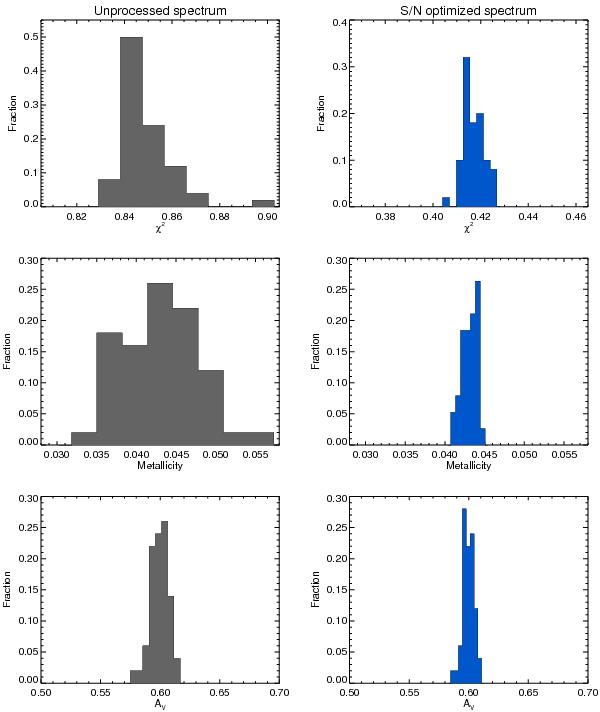
Histograms of the χ2-fitting, metallicity Z and dust attenuation AV distributions obtained from the SSP fitting to 100 simulated spectra based on the noise-residual, as explained in the text. The left-column panels correspond to the fixed-aperture, unprocessed spectrum and the right-column panels to the S/N optimized spectrum of IRAS F12115-4656, as shown in .
Current usage metrics show cumulative count of Article Views (full-text article views including HTML views, PDF and ePub downloads, according to the available data) and Abstracts Views on Vision4Press platform.
Data correspond to usage on the plateform after 2015. The current usage metrics is available 48-96 hours after online publication and is updated daily on week days.
Initial download of the metrics may take a while.