Fig. 5
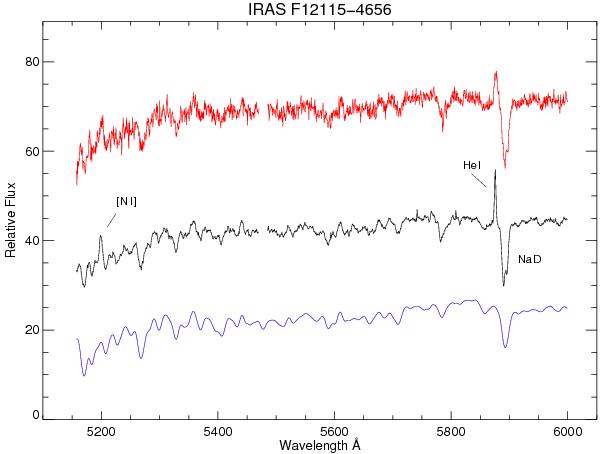
Close-up of the integrated spectrum of the LIRG IRAS F12115-4656. The top-red line corresponds to the spectrum obtained by integrating the VIMOS spaxels within a simulated circular fixed-aperture of 10 arcsec centred on the nucleus of the galaxy in the IFS data cube without any velocity-field correction. The central spectrum in black corresponds to the S/N continuum-optimized integrated spectrum of the same galaxy, some spectral features being labelled for easy identification. The blue spectrum at the bottom corresponds to a simple SSP synthetic model fitted to the S/N-optimized integrated spectrum, as described in the text. All spectra are displayed in a relative flux scale.
Current usage metrics show cumulative count of Article Views (full-text article views including HTML views, PDF and ePub downloads, according to the available data) and Abstracts Views on Vision4Press platform.
Data correspond to usage on the plateform after 2015. The current usage metrics is available 48-96 hours after online publication and is updated daily on week days.
Initial download of the metrics may take a while.