Fig. 4
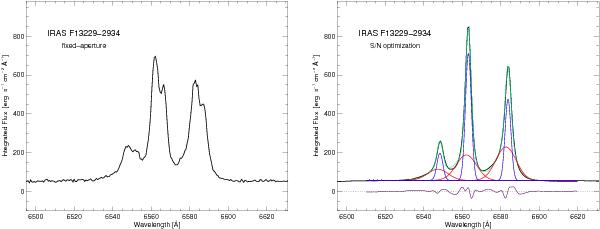
Left: integrated spectrum of the LIRG IRAS F13229-2934 obtained by adding the IFS spaxels within a simulated 10 arcsec circular aperture without any velocity-field correction. Right: the black-line shows in black the integrated spectrum of the same galaxy obtained by applying the S/N optimization method that uses the emission line criterion to the Hα line. The blue and red lines correspond to the fit to both narrow and broad components respectively, while the green line represents for total fit. The residual between the observed spectrum and fit models is shown at the bottom of the panel.
Current usage metrics show cumulative count of Article Views (full-text article views including HTML views, PDF and ePub downloads, according to the available data) and Abstracts Views on Vision4Press platform.
Data correspond to usage on the plateform after 2015. The current usage metrics is available 48-96 hours after online publication and is updated daily on week days.
Initial download of the metrics may take a while.