Fig. 3
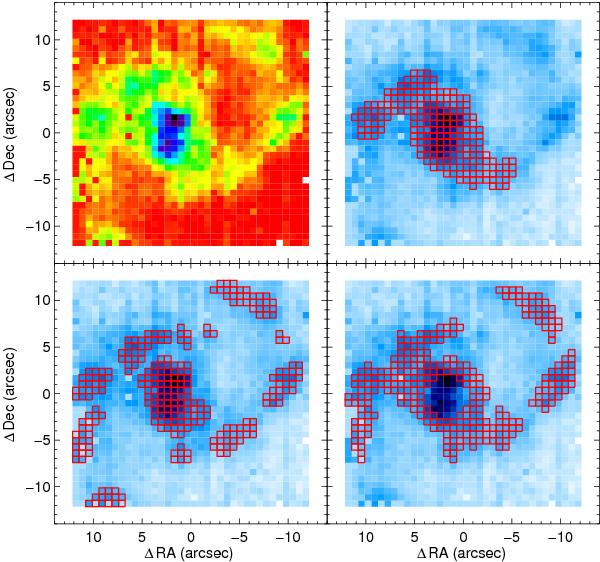
Visual example of the S/N optimization method applied to the VLT-VIMOS observation of the LIRG IRAS F06295–1735. Top-left panel: Hα “narrow-band” image showing the morphology of the barred spiral galaxy. The colour intensity of each spaxel is scaled to the total flux intensity for that particular region, which includes Hα + [NII] line-emission and continuum. Top-right: selected spaxels using the S/N optimization continuum criterion. Bottom-left: selected spaxels after applying a S/N optimization to the Hα emission-line. Bottom-right: continuum S/N selection after discarding the nuclear spaxels in a circular aperture of 2 kpc.
Current usage metrics show cumulative count of Article Views (full-text article views including HTML views, PDF and ePub downloads, according to the available data) and Abstracts Views on Vision4Press platform.
Data correspond to usage on the plateform after 2015. The current usage metrics is available 48-96 hours after online publication and is updated daily on week days.
Initial download of the metrics may take a while.