Fig. 1
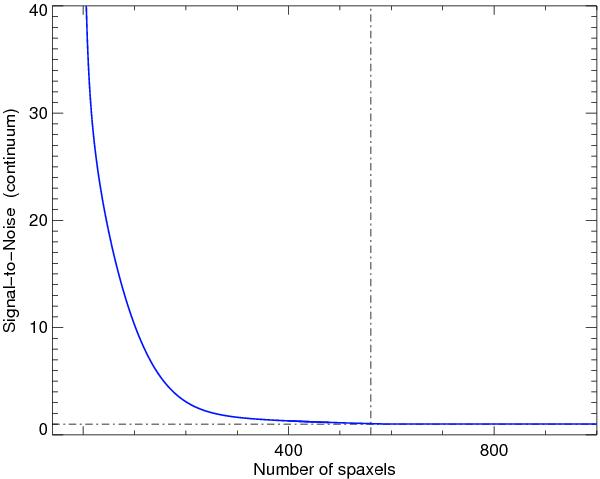
Common behaviour of an IFS spectral cube sorted in decreasing order of the S/N. The figure corresponds to a VIMOS-IFU cube section containing 1000 spaxels of an IFS observation of the nearby LIRG IRAS F06295-1735 with continuum emission. The vertical axis shows the S/N calculated on a relatively featureless narrow continuum band at λc = 6200 Å for each spaxel of the 3D cube, while the horizontal axis corresponds to the spaxels ordered by decreasing (S/N)c. Few spaxels have high S/N (i.e. > 10), decreasing rapidly to values for which the continuum is dominated by noise (S/Nc ~ 1).
Current usage metrics show cumulative count of Article Views (full-text article views including HTML views, PDF and ePub downloads, according to the available data) and Abstracts Views on Vision4Press platform.
Data correspond to usage on the plateform after 2015. The current usage metrics is available 48-96 hours after online publication and is updated daily on week days.
Initial download of the metrics may take a while.