Fig. 4
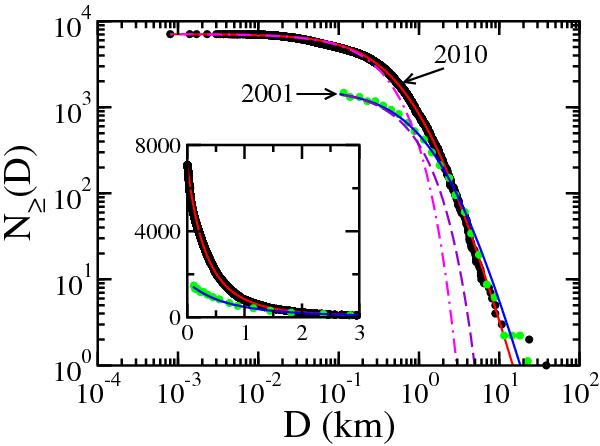
Decreasing cumulative distribution of diameters of known NEAs in 2001 (1649 objects, green dots) and in 2010 (7078 objects, black dots). Solid lines are best fits of q-exponentials (N ≥ (D) = Mexpq(−βqD)). Blue line (2001): q = 1.3, βq = 1.5 km-1, M = 1649, red line (2010): q = 1.3, βq = 3 km-1, M = 7078. Normal exponentials (q = 1) are displayed in the main panel for comparison (dashed violet, with β1 = 1.5 km-1, M = 1649, and dot-dashed magenta, with β1 = 3 km-1, M = 7078).
Current usage metrics show cumulative count of Article Views (full-text article views including HTML views, PDF and ePub downloads, according to the available data) and Abstracts Views on Vision4Press platform.
Data correspond to usage on the plateform after 2015. The current usage metrics is available 48-96 hours after online publication and is updated daily on week days.
Initial download of the metrics may take a while.