Fig. 3
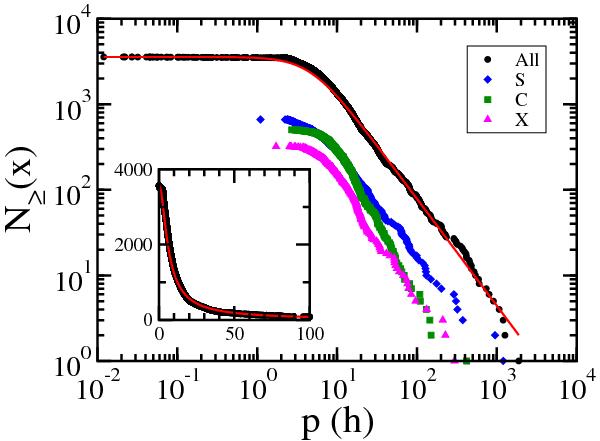
Log-log plot of the decreasing cumulative distribution of periods of 3567 asteroids (dots) with Rel ≥ 2 taken from the PDS (NASA) and a q-Gaussian distribution (N ≥ (p) = Mexpq(−βqp2)) (solid line), with q = 2.6, βq = 0.025 h-2, M = 3567. The other curves are 663 S-complex asteroids (diamonds, blue online), 503 C-complex asteroids (squares, green online), 321 X-complex asteroids (triangles, magenta online). Inset shows the 3567 asteroids and the q-Gaussian in a linear-linear plot.
Current usage metrics show cumulative count of Article Views (full-text article views including HTML views, PDF and ePub downloads, according to the available data) and Abstracts Views on Vision4Press platform.
Data correspond to usage on the plateform after 2015. The current usage metrics is available 48-96 hours after online publication and is updated daily on week days.
Initial download of the metrics may take a while.