Fig. 2
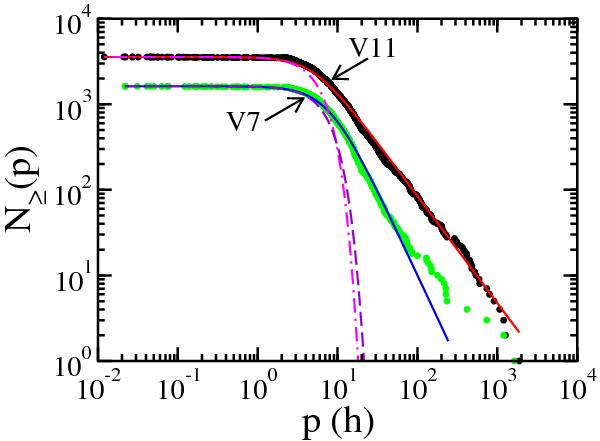
Decreasing cumulative distribution of periods of V7 (green dots on line) and V11 (black dots online) of PDS (NASA) with Rel ≥ 2, and superposed q-Gaussians (N ≥ (p) = Mexpq( − βqp2)). V7: q = 2.0, βq = 0.0161 h-2, M = 1621; V11: q = 2.6, βq = 0.025 h-2, M = 3567. Fittings of the periods of V7 for P > 50 h are poor. This does not happen with V11, and it possibly indicates a better accuracy of the data. Dashed (violet online) and dot-dashed (magenta online) lines are normal (q = 1) Gaussians, with β1 = 0.0161 h-2, M = 1621, and β1 = 0.025 h-2, M = 3567.
Current usage metrics show cumulative count of Article Views (full-text article views including HTML views, PDF and ePub downloads, according to the available data) and Abstracts Views on Vision4Press platform.
Data correspond to usage on the plateform after 2015. The current usage metrics is available 48-96 hours after online publication and is updated daily on week days.
Initial download of the metrics may take a while.