Fig. 1
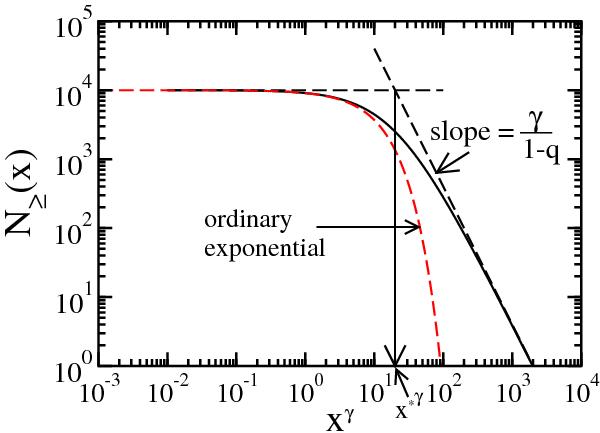
Inverse cumulative distribution of a generalized q-exponential, N ≥ (x) = Mexpq( − βqxγ). γ = 1 is a q-exponential, γ = 2 is a q-Gaussian, M is the size of the sample. Values of the parameters for this particular instance are q = 1.5, βq = 0.1 and M = 104. The transition point (x ∗ )γ given by Eq. (8) is indicated. Dashed curve (red online) is an ordinary (q = 1) exponential with β1 = 0.1 and M = 104. Evidently, the tail behavior is entirely different from both curves.
Current usage metrics show cumulative count of Article Views (full-text article views including HTML views, PDF and ePub downloads, according to the available data) and Abstracts Views on Vision4Press platform.
Data correspond to usage on the plateform after 2015. The current usage metrics is available 48-96 hours after online publication and is updated daily on week days.
Initial download of the metrics may take a while.