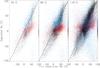
Fig. 5
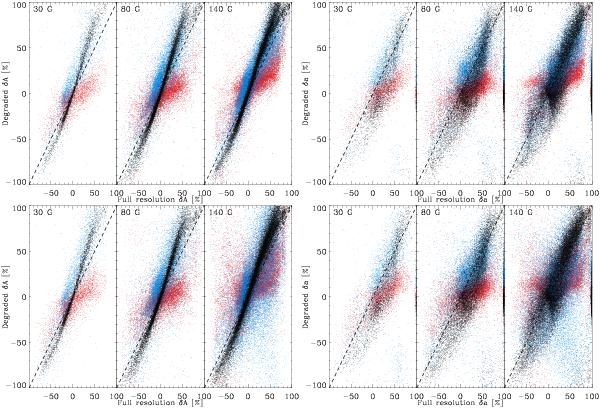
Left panels: area asymmetries obtained on the degraded snapshots (black for “Full (IMaX)” case, red for “Degraded (IMaX)”, and blue for “Reconstructed (IMaX)”) versus the original “Full (all λ)” area asymmetries. Right panels: same but for amplitude asymmetry. The upper panels show results when the wavefront is known with 10% uncertainty, while the lower panels display what happens when the uncertainty increases to 25%.
Current usage metrics show cumulative count of Article Views (full-text article views including HTML views, PDF and ePub downloads, according to the available data) and Abstracts Views on Vision4Press platform.
Data correspond to usage on the plateform after 2015. The current usage metrics is available 48-96 hours after online publication and is updated daily on week days.
Initial download of the metrics may take a while.