Fig. 2
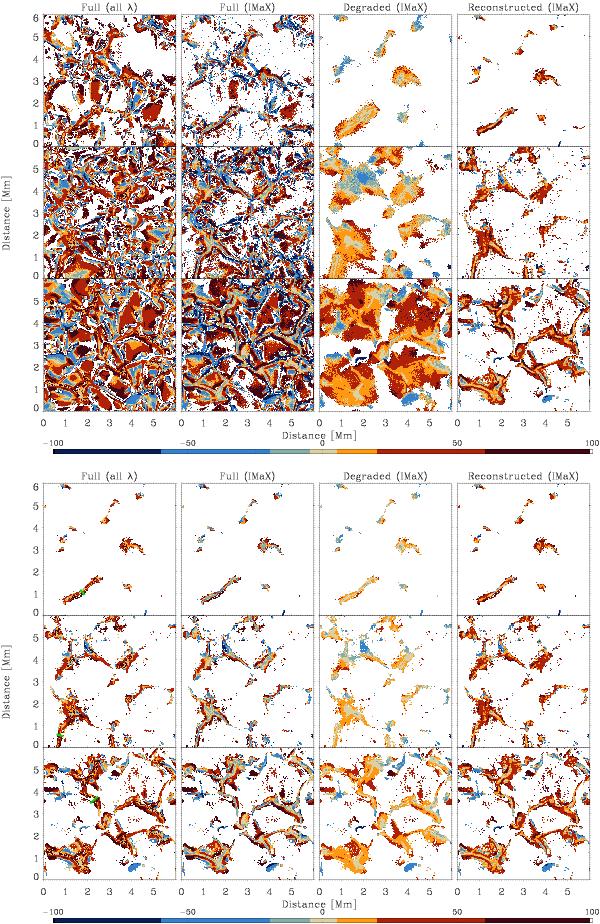
Amplitude asymmetry maps for the four considered smearing cases (columns) and for the three values of the seed magnetic field used (rows): 30 G, 80 G, and 140 G. The upper panels show the map locations where the Stokes V profiles are above the threshold in each individual case. The lower panels display only locations where the Stokes V profiles are above the threshold simultaneously in the four considered cases. The small green lines at positions (2,1) for the upper panels, (0.5,0.5) for the middle panels, and (2.3,3.8) for the lower panels show the location of the cuts along which the Stokes V profiles in Fig. 4 have been obtained.
Current usage metrics show cumulative count of Article Views (full-text article views including HTML views, PDF and ePub downloads, according to the available data) and Abstracts Views on Vision4Press platform.
Data correspond to usage on the plateform after 2015. The current usage metrics is available 48-96 hours after online publication and is updated daily on week days.
Initial download of the metrics may take a while.