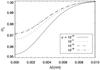
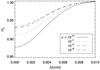
Fig. 2
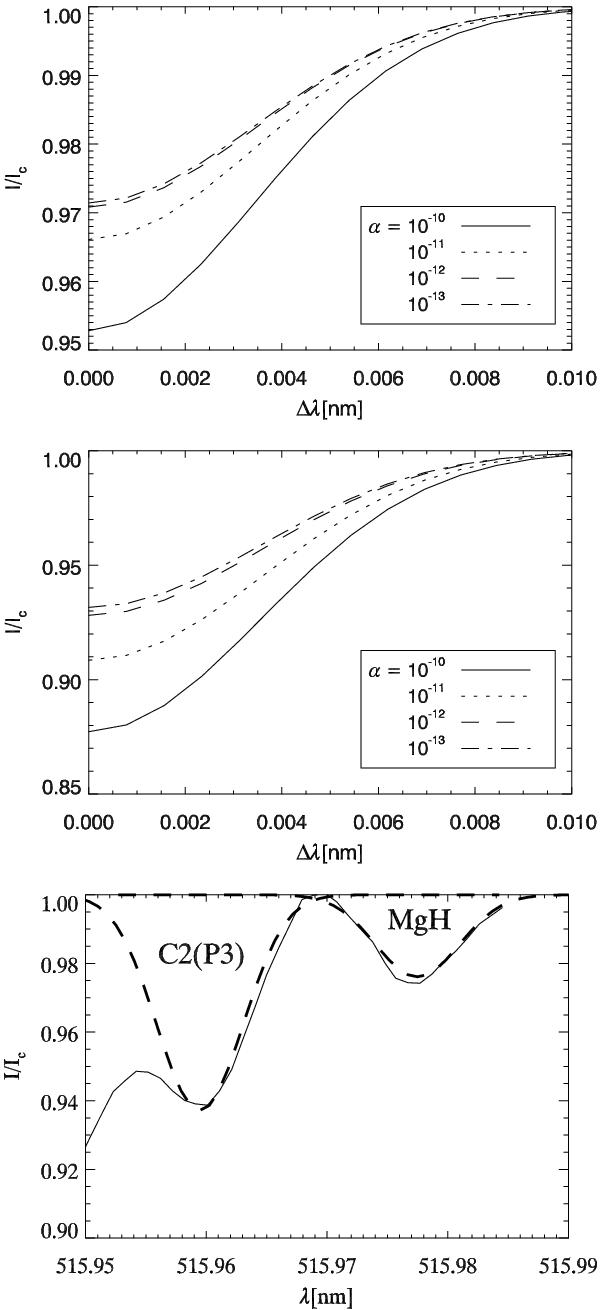
C2 and MgH line profiles computed at 9′′ inside the solar limb with the FALC model, for different values of the parameter α defined in Eq. (15). Upper panel: MgH line, α values result in ϵ = 0.0025, 0.024, 0.2, 0.71 at 200 km above the base of the photosphere. Middle panel: C2 line. Corresponding values of ϵ = 0.007, 0.065, 0.41, 0.87. Lower panel: computed profiles for best-fitting values of α parameter(dashed line) compared with the observations from the atlas (full line).
Current usage metrics show cumulative count of Article Views (full-text article views including HTML views, PDF and ePub downloads, according to the available data) and Abstracts Views on Vision4Press platform.
Data correspond to usage on the plateform after 2015. The current usage metrics is available 48-96 hours after online publication and is updated daily on week days.
Initial download of the metrics may take a while.