Fig. 5
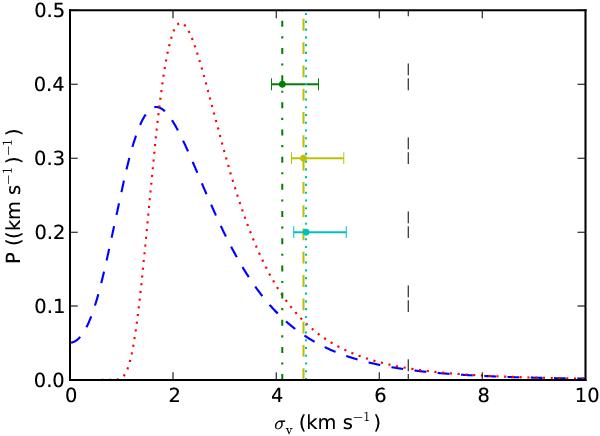
Our estimate of the probability distribution of the velocity dispersion for the massive stars in Westerlund I. The blue dashed line shows the case where the measurement error is set by the variation in the radial velocity between epochs. The red dotted line shows the limit, where we assume no measurement errors. The vertical lines mark the velocity dispersion expected in virial equilibrium under several assumptions explained in Sect. 4. From the highest to lowest estimates, we have the velocity dispersion calculated for a spherical, non-mass-segregated cluster for the mass estimates from Negueruela et al. (2010) (black, long dashed) and Gennaro et al. (2011) (cyan, dotted). For the mass estimate of Gennaro et al. (2011) we also show the expected velocity dispersion taking into account the velocity anisotropy, which is consistent with the elongation of Westerlund I (yellow, dashed), and the case where we take into account both the velocity anisotropy and the possible mass segregation (green, dash-dot). The error bars represent the quoted uncertainty in the photometric mass of Gennaro et al. (2011).
Current usage metrics show cumulative count of Article Views (full-text article views including HTML views, PDF and ePub downloads, according to the available data) and Abstracts Views on Vision4Press platform.
Data correspond to usage on the plateform after 2015. The current usage metrics is available 48-96 hours after online publication and is updated daily on week days.
Initial download of the metrics may take a while.