Fig. 1
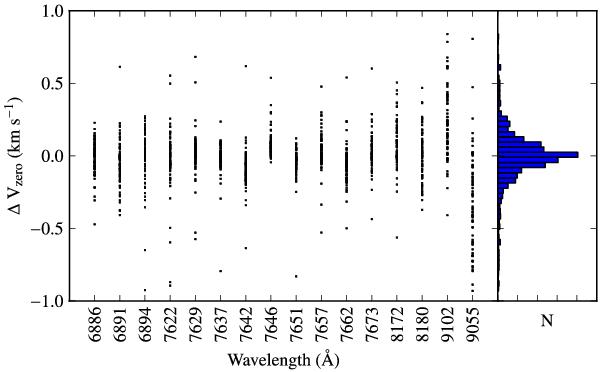
Offset of the velocity zero point measured for the individual telluric lines from the averaged velocity zero point for sixteen wavelength regions containing strong telluric lines. On the x-axis the central wavelength of these regions is given. On the right, the histogram of all these offsets is plotted. The standard deviation in this distribution is about 230 m s-1.
Current usage metrics show cumulative count of Article Views (full-text article views including HTML views, PDF and ePub downloads, according to the available data) and Abstracts Views on Vision4Press platform.
Data correspond to usage on the plateform after 2015. The current usage metrics is available 48-96 hours after online publication and is updated daily on week days.
Initial download of the metrics may take a while.