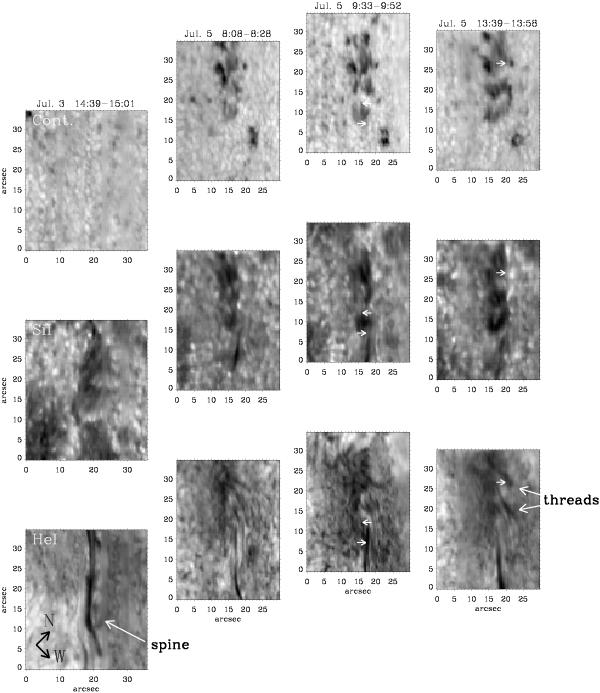
Fig. 5

From left to right slit-reconstructed images from the Tenerife Infrared Polarimeter (TIP-II) at different times. From top to bottom several wavelengths are presented that represent different layers in the atmosphere, from the photosphere to the chromosphere: continuum, Si i 10 827 Å line center and He i 10 830 Å red core intensities. The panels are located at different positions to approximately represent the alignment of their respective FOVs. The small white arrows indicate the position of the Stokes profiles presented in Figs. 7–9.
Current usage metrics show cumulative count of Article Views (full-text article views including HTML views, PDF and ePub downloads, according to the available data) and Abstracts Views on Vision4Press platform.
Data correspond to usage on the plateform after 2015. The current usage metrics is available 48-96 hours after online publication and is updated daily on week days.
Initial download of the metrics may take a while.


