Fig. 3
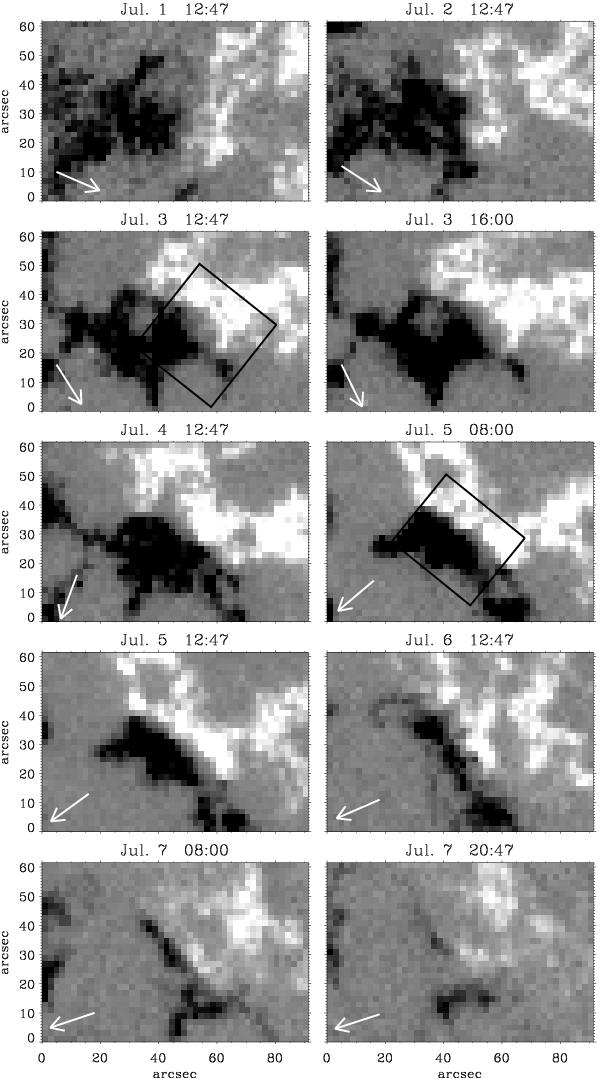
SOHO/MDI line-of-sight magnetogram evolution of the compact plage between July 1 and 7 of 2005. Note that the date and time of each panel does not correspond to the panels in Fig. 2. Images are saturated at ± 400 G. Solar north and west correspond to up and right, respectively. The black boxes show the approximate scanned area of TIP-II for both days. On July 3, the space between both polarities broadens in the lower part of the PIL, whereas in the following days the whole AR is more compact. The size of the panels corresponds to the black rectangle in Fig. 2. White arrows indicate the direction to disk center.
Current usage metrics show cumulative count of Article Views (full-text article views including HTML views, PDF and ePub downloads, according to the available data) and Abstracts Views on Vision4Press platform.
Data correspond to usage on the plateform after 2015. The current usage metrics is available 48-96 hours after online publication and is updated daily on week days.
Initial download of the metrics may take a while.