Fig. 2
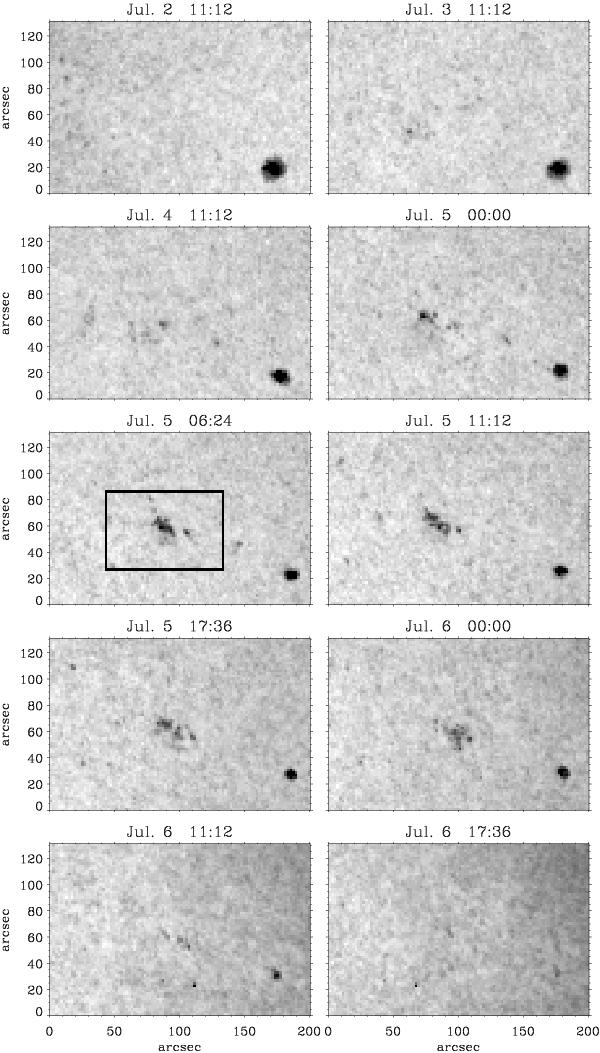
Time sequence of SOHO/MDI continuum images of the whole active region NOAA 10781 between July 2 and 6 of 2005. The black box shows the size and location of the maps of Fig. 3, which have a smaller but more detailed FOV. A developed sunspot can be seen at the bottom right corner of the AR. Between July 2 and 3 the center of the AR was almost devoid of pores. On July 5 we increased the cadence of the sequence in order to show the quick appearance of new pores and orphan penumbrae at the PIL during that day.
Current usage metrics show cumulative count of Article Views (full-text article views including HTML views, PDF and ePub downloads, according to the available data) and Abstracts Views on Vision4Press platform.
Data correspond to usage on the plateform after 2015. The current usage metrics is available 48-96 hours after online publication and is updated daily on week days.
Initial download of the metrics may take a while.