Fig. 13
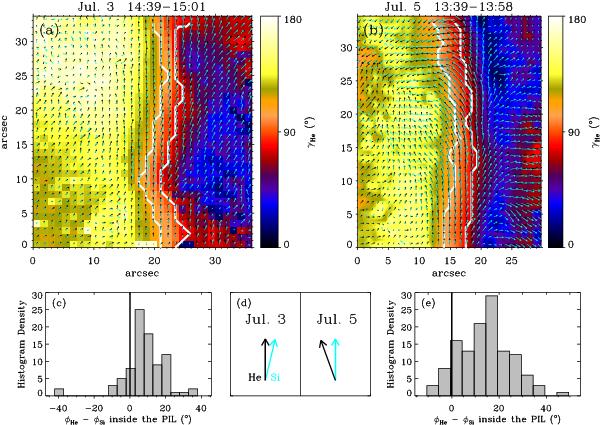
a, b) Background color image shows the inclination angle γHe inferred from the He i inversions. Superimposed black (blue) arrows indicate the helium (silicon) horizontal fields in the local frame of reference. The white contour along the y-axis encloses horizontal fields according to the criterion of inclinations between 75° < γHe < 105°. c, e) Histogram densities of the inferred azimuth differences between helium and silicon, φHe − φSi, only for the arrows that are enclosed within the white contour in the a) and b) panels. d) Most common azimuth configurations between helium and silicon above y ~ 8 and y ~ 12, for July 3 and 5 respectively.
Current usage metrics show cumulative count of Article Views (full-text article views including HTML views, PDF and ePub downloads, according to the available data) and Abstracts Views on Vision4Press platform.
Data correspond to usage on the plateform after 2015. The current usage metrics is available 48-96 hours after online publication and is updated daily on week days.
Initial download of the metrics may take a while.