Fig. 10
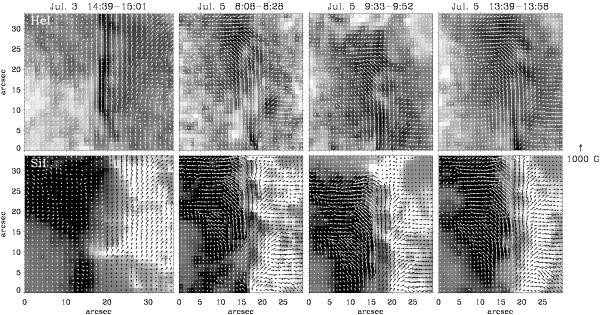
Top: four gray-scale slit reconstructed images representing He i red core intensity, increasing with time from left to right. Superimposed are white arrows indicating the horizontal magnetic fields observed with TIP-II in the He i 10 830 Å multiplet after solving the 180° ambiguity. Especially in the top right panel the magnetic field lines are well aligned with the dark He i threads. Bottom: background images show photospheric vertical fields  observed with TIP-II in the Si i 10 827 Å spectral line. The images are saturated at ± 400 G to emphasize the PIL. The black and white arrows (depending on the background for a better contrast) represent the horizontal fields. The arrows are parallel to the polarity inversion line, which lies in the gray area between 15 and 20 arcsec on the x-axis and extends from the lower to the upper part of each panel.
Current usage metrics show cumulative count of Article Views (full-text article views including HTML views, PDF and ePub downloads, according to the available data) and Abstracts Views on Vision4Press platform.
Data correspond to usage on the plateform after 2015. The current usage metrics is available 48-96 hours after online publication and is updated daily on week days.
Initial download of the metrics may take a while.