Fig. 3
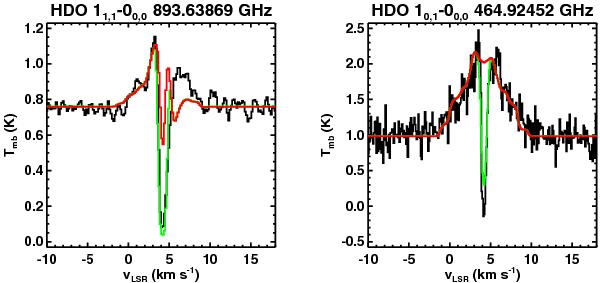
In black: HDO 11,1−00,0 and 11,0−00,0 absorption lines observed at 894 GHz with HIFI and at 465 GHz with JCMT, respectively. In red: HDO modeling without adding the absorbing layer. In green: HDO modeling when adding an absorbing layer with a HDO column density of ~2.3 × 1013 cm-2. The continuum for both the 894 GHz and 465 GHz lines refers to SSB data.
Current usage metrics show cumulative count of Article Views (full-text article views including HTML views, PDF and ePub downloads, according to the available data) and Abstracts Views on Vision4Press platform.
Data correspond to usage on the plateform after 2015. The current usage metrics is available 48-96 hours after online publication and is updated daily on week days.
Initial download of the metrics may take a while.