Fig. 8
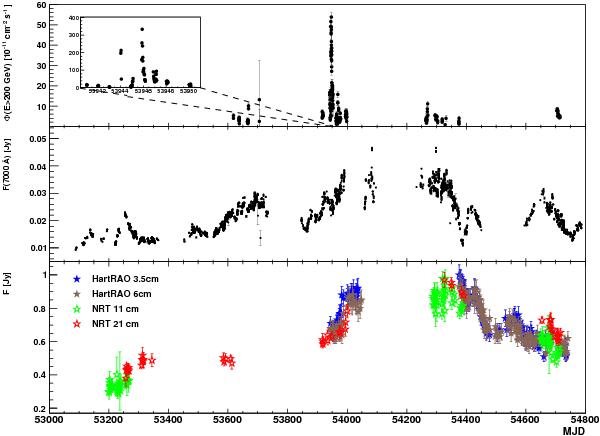
Long-term light curves from VHE γ-ray measurements (upper panel: H.E.S.S.), optical data (middle panel: ROTSE) and radio data (lower panel: NRT and HartRAO). Please note that the y-axis is truncated for the long-term H.E.S.S. light curve due to the large dynamic range caused by the flares. A zoom on the period covering the two VHE flares is shown in an inset in the upper panel.
Current usage metrics show cumulative count of Article Views (full-text article views including HTML views, PDF and ePub downloads, according to the available data) and Abstracts Views on Vision4Press platform.
Data correspond to usage on the plateform after 2015. The current usage metrics is available 48-96 hours after online publication and is updated daily on week days.
Initial download of the metrics may take a while.