Fig. 7
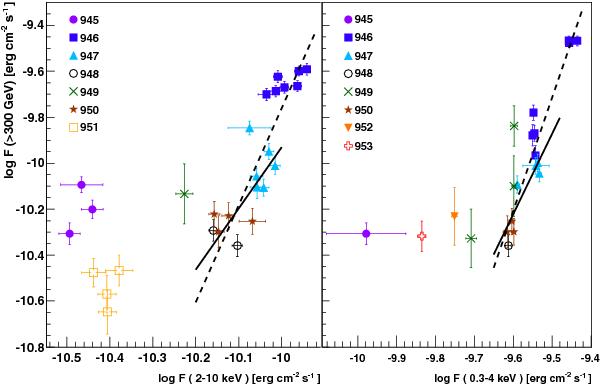
Correlation between the integrated VHE flux and the integrated RXTE (left) and Swift XRT fluxes (right). The labels indicate the dates of observations (MJD - 53 000). The points represent averages over simultaneous time intervals of 10 min (except for the H.E.S.S./RXTE point from MJD 53 949 and the H.E.S.S./XRT point from MJD 53 952 that correspond to a 30 min time window, as well as the H.E.S.S./XRT point from MJD 53 953, corresponding to a 90 min interval). The statistical uncertainties on the logarithmic fluxes are approximated with symmetric error bars. The two lines in each panel show power law fits to subsets of the data: the dashed lines include all “high flux” data, while the fits marked with solid lines include all “high flux” data except for the data from the night of Flare 2 (MJD 53 946).
Current usage metrics show cumulative count of Article Views (full-text article views including HTML views, PDF and ePub downloads, according to the available data) and Abstracts Views on Vision4Press platform.
Data correspond to usage on the plateform after 2015. The current usage metrics is available 48-96 hours after online publication and is updated daily on week days.
Initial download of the metrics may take a while.