Fig. 13
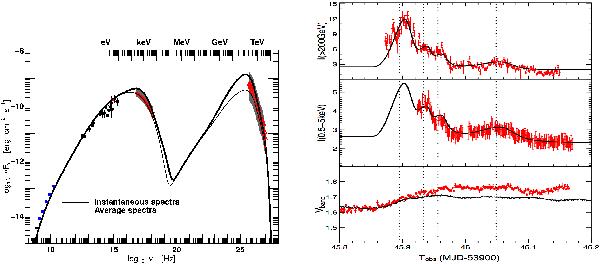
Time dependent SSC model (Model 3) for the night of MJD 53 946. Left panel: SED of PKS 2155 − 304, including the band of the varying Chandra spectrum and the band of the varying H.E.S.S. spectrum. Nightly averaged spectra for Chandra and H.E.S.S. are indicated by red points. The optical flux detected by the Bronberg Observatory for this night is added as a red point; data from ATCA are presented as blue points. The thick line shows a snapshot of the modelled SED at a given state of the source, while the thin line shows the modelled spectra averaged over the H.E.S.S. observation period. Black data points indicate archival (non-simultaneous) data. Right panel: the points represent the H.E.S.S. (upper panel), Chandra (middle panel), and Bronberg (lower panel) light curves in units of 10-10 erg cm-2 s-1. The solid lines are the light curves computed by the model in these three energy ranges.
Current usage metrics show cumulative count of Article Views (full-text article views including HTML views, PDF and ePub downloads, according to the available data) and Abstracts Views on Vision4Press platform.
Data correspond to usage on the plateform after 2015. The current usage metrics is available 48-96 hours after online publication and is updated daily on week days.
Initial download of the metrics may take a while.