Fig. 12
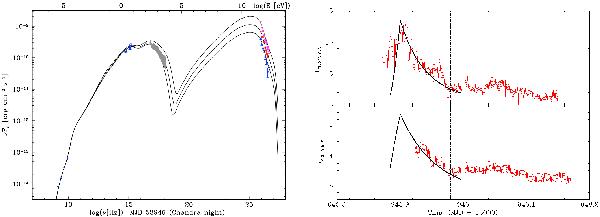
Time dependent SSC model (Model 2) for the night of MJD 53 946. Left panel: H.E.S.S. spectra at three different states of the source are shown. The varying X-ray spectrum seen by the Chandra telescope is indicated by a dark grey band. Snapshots of the SED resulting from the model for the three different states are presented by solid lines. Optical and UV data from Swift UVOT and radio data from ATCA are shown as green points. Right panel: the light curves in the VHE band (H.E.S.S., upper panel) and in the X-ray band (Chandra, lower panel) are shown in units of 10-10 erg cm-2 s-1, together with the predicted time evolution of the model. The times corresponding to the three H.E.S.S. spectra in the left panel are marked here by three vertical dash-dotted lines.
Current usage metrics show cumulative count of Article Views (full-text article views including HTML views, PDF and ePub downloads, according to the available data) and Abstracts Views on Vision4Press platform.
Data correspond to usage on the plateform after 2015. The current usage metrics is available 48-96 hours after online publication and is updated daily on week days.
Initial download of the metrics may take a while.