Fig. 11
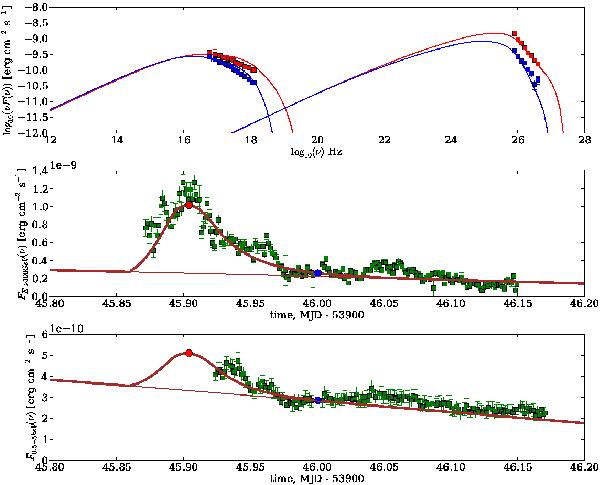
Time dependent SSC model (Model 1) for the night of MJD 53 946. The upper panel shows the modelled SED at the maximum flux level and at a low level. Snapshots of the Chandra spectrum and the H.E.S.S. spectrum are shown for a high state (red squares) and for a low state (blue squares). The two flux states that were chosen for the modelled SEDs correspond to the red and blue circles in the middle and bottom panel, where the H.E.S.S. and Chandra light curves are shown together with the predicted time evolution of the model. The thin line in the middle and bottom panel indicates the long-term component that dominates the X-ray flux. The two spectra from Chandra correspond to the beginning and the plateau of the Chandra lightcurve, as described by Aharonian et al. (2009b); the H.E.S.S. spectra correspond to the data acquisition periods closest in time to the modelled flux states.
Current usage metrics show cumulative count of Article Views (full-text article views including HTML views, PDF and ePub downloads, according to the available data) and Abstracts Views on Vision4Press platform.
Data correspond to usage on the plateform after 2015. The current usage metrics is available 48-96 hours after online publication and is updated daily on week days.
Initial download of the metrics may take a while.