Fig. 10
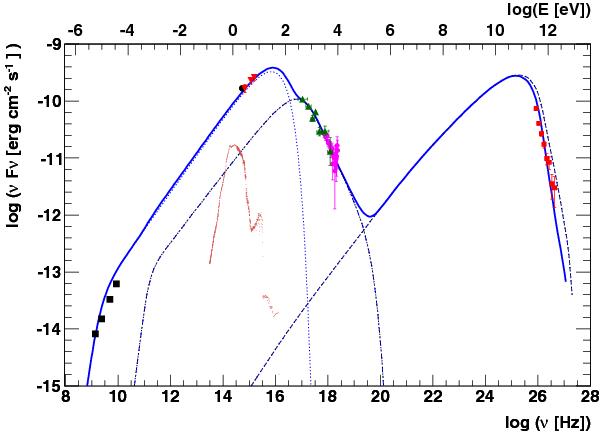
SED for a night with relatively low VHE and X-ray flux (MJD 53 945) with a stationary SSC model described in the text. Data taken during this night are shown from H.E.S.S. (red squares), RXTE (magenta circles), Swift XRT (green triangles), Swift UVOT (red triangles) and Bronberg (black circle). The black squares are the average ATCA points from the period of the MWL campaign. The model is presented as a solid line, giving the overall SED, including absorption by the EBL. The dashed line in the VHE range is the de-absorbed spectrum. The H.E.S.S. data points represent the measured (i.e. absorbed) flux. The extended jet emission (dotted line) and host galaxy contribution (brown data points) are also shown at low frequencies. Dash-dotted and dashed lines indicate the synchrotron and SSC contributions from the blob, respectively.
Current usage metrics show cumulative count of Article Views (full-text article views including HTML views, PDF and ePub downloads, according to the available data) and Abstracts Views on Vision4Press platform.
Data correspond to usage on the plateform after 2015. The current usage metrics is available 48-96 hours after online publication and is updated daily on week days.
Initial download of the metrics may take a while.