Fig. 1
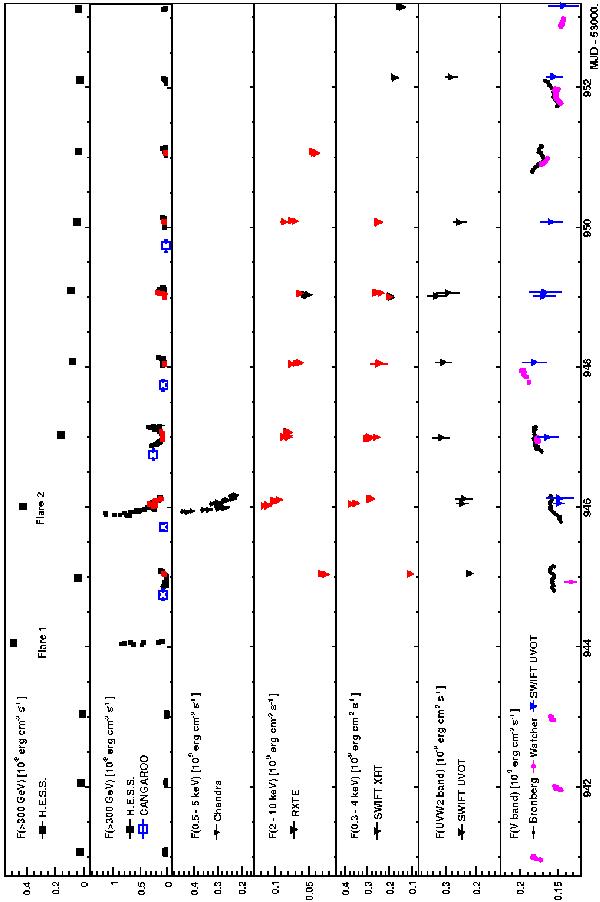
Light curves in the VHE, X-ray, UV and optical bands during the MWL campaign. Details on the different data sets are given in the text. “Flare 1” and “Flare 2” refer to the two exceptional VHE flares seen before and during the MWL campaign. All light curves are binned in intervals of 10 min, except for the nightly averaged H.E.S.S. fluxes (first panel) and the averaged CANGAROO fluxes (second panel). The published flux from CANGAROO has a threshold of 660 GeV. It has been extrapolated down to 300 GeV for comparison with H.E.S.S. The H.E.S.S. points marked in red correspond to nights where simultaneous data are available either from RXTE or from Swift XRT. The corresponding simultaneous points are also marked in red in the light curves from the latter. The Swift UVOT flux densities (Foschini et al. 2008) in the UVW2 and v bands have been multiplied by 1928 Å and 5500 Å, respectively. The UVOT error bars include systematic errors.
Current usage metrics show cumulative count of Article Views (full-text article views including HTML views, PDF and ePub downloads, according to the available data) and Abstracts Views on Vision4Press platform.
Data correspond to usage on the plateform after 2015. The current usage metrics is available 48-96 hours after online publication and is updated daily on week days.
Initial download of the metrics may take a while.