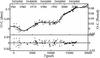
Fig. 6
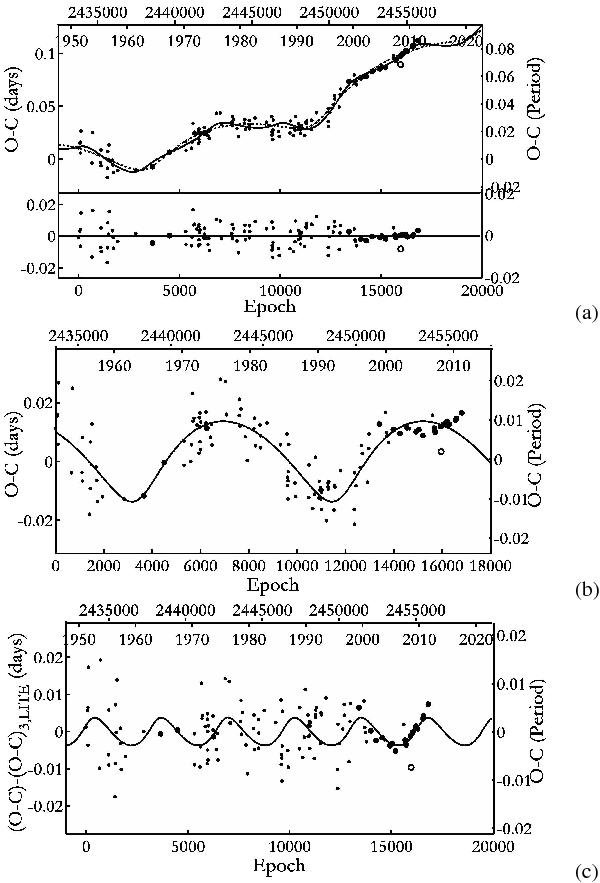
a) The O−C diagram of V338 Her fitted by two LITE curves and a parabola (upper part) and the total residuals after the subtraction of the complete fitting function (lower part). The solid line indicates the combined fitting terms, while the dashed line corresponds to the parabola and the first LITE function. b) Residuals after removal of the parabolic term fitted by the first LITE curve. c) Residuals after removal of both the first LITE curve and the parabola fitted by the second LITE term.
Current usage metrics show cumulative count of Article Views (full-text article views including HTML views, PDF and ePub downloads, according to the available data) and Abstracts Views on Vision4Press platform.
Data correspond to usage on the plateform after 2015. The current usage metrics is available 48-96 hours after online publication and is updated daily on week days.
Initial download of the metrics may take a while.