Fig. 4
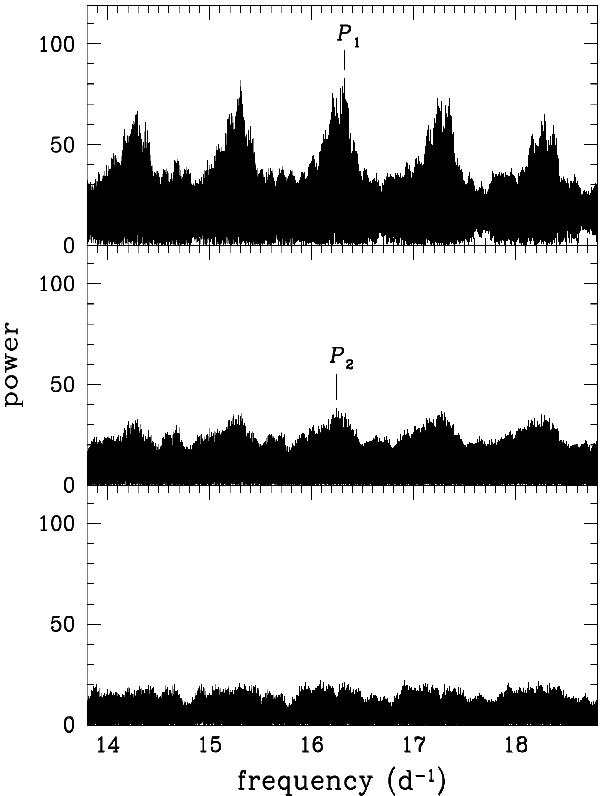
A portion of the power spectrum of our radial velocities data base;top panel: the power spectrum of the original data shows a forest of aliases produced by the sampling, the highest of which corresponds to period P1 = 0.06126454 d;middle panel: the power spectrum of the residuals after subtraction of P1 still suggests a significant modulation with period P2 = 0.0615558 d (see text);bottom panel: when both periods are subtracted the residuals basically show a flat pattern.
Current usage metrics show cumulative count of Article Views (full-text article views including HTML views, PDF and ePub downloads, according to the available data) and Abstracts Views on Vision4Press platform.
Data correspond to usage on the plateform after 2015. The current usage metrics is available 48-96 hours after online publication and is updated daily on week days.
Initial download of the metrics may take a while.