Fig. 4
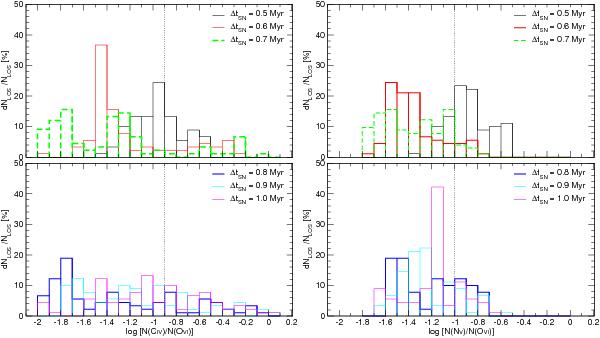
Histogram of the LOS measurements of the column density ratios N(Civ)/N(Ovi) (left panel) and N(Nv)/N(Ovi) (right panel) inside the simulated LB (lLOS < 100 pc) for 0.5–1.0 Myr after the last SN explosion. The vertical dotted line marks the critical column density ratios of −0.9 (left) and −1.0 (right), respectively (for details see text).
Current usage metrics show cumulative count of Article Views (full-text article views including HTML views, PDF and ePub downloads, according to the available data) and Abstracts Views on Vision4Press platform.
Data correspond to usage on the plateform after 2015. The current usage metrics is available 48-96 hours after online publication and is updated daily on week days.
Initial download of the metrics may take a while.