| Issue |
A&A
Volume 539, March 2012
|
|
|---|---|---|
| Article Number | A4 | |
| Number of page(s) | 6 | |
| Section | Cosmology (including clusters of galaxies) | |
| DOI | https://doi.org/10.1051/0004-6361/201117143 | |
| Published online | 17 February 2012 | |
Dark energy and extended dark matter halos
1 Tuorla ObservatoryDepartment of Physics and Astronomy, University of Turku, 21500 Piikkiö, Finland
e-mail: This email address is being protected from spambots. You need JavaScript enabled to view it.
2 Sternberg Astronomical Institute, Moscow University, 119899 Moscow, Russia
3 University of Alabama, Tuscaloosa, AL 35487-0324, USA
Received: 27 April 2011
Accepted: 22 December 2011
Abstract
The cosmological mean matter (dark and baryonic) density measured in the units of the critical density is Ωm = 0.27. Independently, the local mean density is estimated to be Ωloc = 0.08−0.23 from recent data on galaxy groups at redshifts up to z = 0.01−0.03 (as published by Crook et al. 2007, ApJ, 655, 790 and Makarov & Karachentsev 2011, MNRAS, 412, 2498). If the lower values of Ωloc are reliable, as Makarov & Karachentsev and some other observers prefer, does this mean that the Local Universe of 100–300 Mpc across is an underdensity in the cosmic matter distribution? Or could it nevertheless be representative of the mean cosmic density or even be an overdensity due to the Local Supercluster therein. We focus on dark matter halos of groups of galaxies and check how much dark mass the invisible outer layers of the halos are able to host. The outer layers are usually devoid of bright galaxies and cannot be seen at large distances. The key factor which bounds the size of an isolated halo is the local antigravity produced by the omnipresent background of dark energy. A gravitationally bound halo does not extend beyond the zero-gravity surface where the gravity of matter and the antigravity of dark energy balance, thus defining a natural upper size of a system. We use our theory of local dynamical effects of dark energy to estimate the maximal sizes and masses of the extended dark halos. Using data from three recent catalogs of galaxy groups, we show that the calculated mass bounds conform with the assumption that a significant amount of dark matter is located in the invisible outer parts of the extended halos, sufficient to fill the gap between the observed and expected local matter density. Nearby groups of galaxies and the Virgo cluster have dark halos which seem to extend up to their zero-gravity surfaces. If the extended halo is a common feature of gravitationally bound systems on scales of galaxy groups and clusters, the Local Universe could be typical or even an overdense region, with a low density contrast ~1.
Key words: dark matter / dark energy / galaxies: groups: general
© ESO, 2012
1. Introduction
Increasingly complete data have been recently gathered on the distribution and motions of galaxies and their systems in the Local Universe (LU) at redshifts up to z = 0.01 − 0.03 or distances 50–150 Mpc from us (Crook et al. 2007, 2008; Abate & Erdogdu 2009; Makarov & Karachentsev 2011). As a major result from these data, new estimates of the mean local matter (dark and baryonic) density ρloc have been derived. The reported values depend on the methods of mass determination and algorithms of group identification and carry considerable uncertainty: Ωloc = 0.08−0.23, expressed in the units of the critical cosmological density ρc = 0.92 × 10⁻²⁹ g cm-3.
Makarov & Karachentsev (2011) prefer the lowest local density values as the most reliable. Earlier independent estimates from galaxy groups gave also low values: ≃ 0.1 was reported by Vennik (1984), Tully (1987), and Magtesyan (1988), Karachentsev (2005) derives Ωloc ≃ 0.1 for a volume of 20 Mpc across. The estimates near Ωloc ≃ 0.1 (about 1/3 of the mean global matter density Ωcos = 0.27; Spergel et al. 2007) seem to imply that the LU is an underdense region (Makarov & Karachentsev 2011).
1.1. Local vs. global density
The cosmic matter distribution is regarded as uniform and having the average density Ωcos over scales exceeding 300 − 1000 Mpc, the size of the cosmic cell of uniformity. In various smaller volumes inside the cell, the mean density may be lower or higher than the cosmological one. The LU is one of such small volumes. Notably, it contains a large structure, the Local Supercluster of ~100 Mpc in size, and is intersected by the still larger Paturel’s hypergalaxy (Paturel et al. 1988). Most of the galaxy groups and clusters of the inner parts of the LU are gathered in the Local Supercluster. Also, the radial behaviour of the average galaxy number density n(r) around us, up to about 150 Mpc or even more, appears to have a decreasing trend n(r) ∝ r-0.8 (Teerikorpi et al. 1998; Courtois et al. 2004; Teerikorpi 2004). Therefore, one may not be surprised if the LU were found to be rather an overdense region. For instance, if the r-0.8 law is valid up to a possible uniformity scale 300 Mpc, and mass follows light, the local density contrast δ = (Ωloc − Ωcos)/Ωcos within 120 Mpc would be ~1.
Thus, it is puzzling that the derived masses suggest that the LU is an underdensity, contrary to the spatial distribution of galaxies which may indicate overdensity.
This is a complex problem which needs more observational and theory studies. Here we discuss one major aspect: are the recent estimates of the local matter density using virial masses of galaxy systems possibly missing a part of the mass? Could this extra mass be sufficient to increase the density up to Ωloc ≥ Ωcos? In particular, we consider the outer parts of the dark halos of groups as possible reservoirs of dark matter. This is also needed for any estimate of how much dark matter could be in the space between the groups.
In fact, Crook et al. (2007) argue that considerable amounts of dark matter may hide in the halos of the groups which may extend beyond the “contour that was inferred from luminous matter”. Rines & Diaferio (2006) also conclude that a substantial amount of mass exists outside the virial radius of clusters. Hartwick (2011) also considers this as possible from a study of the Hubble flow around groups.
Indeed, the outer parts of the dark matter halos are usually invisible; they are void of bright galaxies and usually contain only dwarf galaxies which are unseen at large distances. Therefore the total size of a dark halo cannot be derived directly from observations of the inner halo traced by the brightest galaxies of the group. As a result, the outer layers are not included in usual mass determinations.
1.2. Extended dark halos?
To check this possibility quantitatively, we use theory models of extended dark halos which enable us to estimate the potential matter “capacity” of the halos. Applying the models to the data of the catalogues by Crook et al. (2007) and Makarov & Karachentsev (2011), we find principal upper limits of the total size and mass of a typical group halo.
Our approach to the physics of galaxy groups uses the standard ΛCDM cosmology where all cosmic bodies are imbedded in the dark energy background now dominating the total cosmic energy density. Dark energy is described by Einstein’s cosmological constant Λ, so that its density is perfectly uniform and constant in time. It produces antigravity which now rules the global cosmic dynamics.
It is important for our discussion that dark energy (initially discovered at horizon-scale distances) affects not only global cosmic dynamics, but also the dynamics on scales of galaxy groups, clusters and superclusters (Chernin et al. 2000; Chernin 2001, 2008; Baryshev et al. 2001; Nowakowski et al. 2002; Karachentsev et al. 2003; Manera & Mota 2006; Nunes & Mota 2006; Peirani & Freitas Pacheco 2006). Because the general properties of dark energy are universal, we may borrow their description from the cosmological model and General Relativity (e.g., the Kötler solution or Schwarzschild-de Sitter spacetime, Einstein-Straus model, etc.). On local scales, the antigravity force produced by the dark energy background may be adequately treated in terms of Newtonian mechanics.
Dark energy effects on astrophysical and cosmological configurations described by a polytropic equation of state were studied by Balaguera-Antolińez et al. (2007) who derived the conditions for equilibrium and stability of such configurations. Other important aspects of local dark energy were noticed in the works by Nowakowski (2001), Iorio (2006), B hmer & Fodor (2008), and Mota (2008).
The key parameter in the local gravity-antigravity force field is the zero-gravity radius, RZG. It determines the maximal size of a gravitationally bound system: the gravity of the group mass dominates at the distances less than RZG from the group center, while dark energy antigravity dominates at larger distances (Chernin et al. 2000; Chernin 2001; Karachentsev et al. 2003; Teerikorpi et al. 2008).
In Sect. 2, the recent catalogues of galaxy groups are briefly described; in Sect. 3, basic theory relations for the gravity-antigravity force field on group and cluster scales are presented in terms of Newtonian mechanics; in Sect. 4, the matter capacity of extended dark halos is evaluated; in Sect. 5, the results are summarized.
2. Groups of galaxies: three catalogues
Crook et al. (2007, 2008) identified the galaxy groups with a percolation algorithm applied to the well-known Two Micron All-Sky Survey Extended Source Catalog. Subsequently measured redshifts for the galaxies with K < 11.25 mag were also used. The total number of groups having 3 or more members is 2796 up to the redshift z = 0.03. The data are presented in two catalogues: the first one contains low-density-contrast (δρ/ρ = 12) groups (hereafter the LDC Catalogue) and the second one contains high-density-contrast (δρ/ρ = 80) groups (the HDC Catalogue). There are 1538 groups in the LDC Catalogue and 1258 groups in the HDC Catalogue.
2.1. Results from the catalogues
Assuming that the observed groups are virialized systems, Crook et al. (2007, 2008) estimate their masses in two ways. The “virial mass” is given by 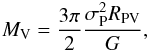 (1)where G is the gravitational constant and σP is the projected velocity dispersion,
 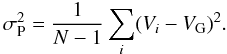 (2)Here Vi and VG are the individual radial velocity of a galaxy and the average radial velocity of the group, respectively; RPV is the projected virial radius,
 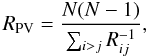 (3)where Rij is the projected distance between two galaxies in the group, N is the number of galaxies in the group.
The “projective mass” is estimated with the relation (Bahcall & Tremaine 1981; Heisler et al. 1985) 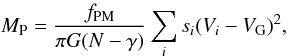 (4)where si is the projected distance of a galaxy from the group center; the constant parameters are γ = 1.5,fPM = 10.2.
The median values of the two masses are calculated for the systems with N = 5 or more; it is found (Crook et al. 2008) that MV = 7 × 10¹³ M⊙,MP = 1 × 10¹⁴ M⊙ for the LDC Catalogue and MV = 3 × 10¹³ M⊙,MP = 4 × 10¹³ M⊙ for the HDC Catalogue. Note that in both catalogues the characteristic masses are 30–100 times larger than the masses of “ordinary” groups like the Local Group.
The median values of the group sizes are RPV = 1.87 Mpc and 0.89 Mpc for the LDC and HDC catalogues, respectively. The median values of the velocity dispersion are σP = 196 (LDC) and 187 km s-1 (HDC). The characteristic mass-to-luminosity ratios in the K-band (the solar units) are MV/LK = 50,MP/LK = 79 (LDC), and MV/LK = 32,MP/LK = 44 (HDC). The M/LK ratio corresponding to the critical cosmological density is 353.
Finally, Crook et al. (2008) estimate the mean local matter density in the units of the critical density: Ωloc = 0.14 and 0.22 come from the virial and projective mass estimates, respectively, for the LDC Catalogue and Ωloc = 0.09 and 0.13 for the HDC Catalogue. The largest value Ωloc = 0.22 is not too far from the cosmological mean matter density Ωm = 0.27, while the three other estimates are all significantly less than Ωm. As Crook et al. (2008) comment. “This suggests that the dark matter halos extend beyond the δρ/ρ = 80 density-contrast contour that was inferred from luminous matter”.
A significant gap between the local and global matter densities was also found by Makarov & Karachentsev (2011) with their recent catalogue of galaxies (hereafter the MK Catalogue). It covers the entire Local Supercluster with its distant outskirts, surrounding voids and ridges of the neighboring clusters, and contains 1082 groups at distances up to 45 Mpc; 395 of them consist of 4 or more members. The catalogue gives the mean projected radius RP = 0.268 Mpc and the virial and projected masses MV = 2.4 1012 M⊙ and MP = 3.3 1012 M⊙, respectively. The mean local matter density, Ωloc = 0.08 ± 0.02 is near the lowest figure in Crook et al. (2007, 2008).
The gap is even 2 times broader, if the Local Universe is an overdensity with the contrast of δ ≃ 1 (Sect. 1).
2.2. On the density estimates
The dark matter tracer used in the catalogues is galaxies and galaxy groups, and the important assumption is that the dark matter is located at least mainly in these systems, in particular in their visible inner parts.
Makarov & Karachentsev (2011) state: “To reduce the Ωm discrepancy, one ought to assume that the total mass of each group and cluster is about 3 times its virial mass. However, ... the total mass of nearby groups and Virgo, Fornax clusters within the radius of zero velocity surface is almost the same as their virial masses... Therefore, the existence of large amount of dark matter at periphery of systems is inconsistent with the observational data”.
Indeed, for nearby well-studied systems the masses derived from the outflow velocities of surrounding galaxies suggest that the total masses derived from the virial theorem are not significantly in error. The situation can be quite different for the much more numerous distant, less well observed groups.
Part of the dark matter could lie outside of galaxy groups/clusters and hence would not be included in the inventory based on virial studies. Makarov & Karachentsev (2011) mention the possibility that there the “missing” part is either concentrated in dark clumps or may form a homogeneous dark ocean. Also, dark matter might lie in filaments, and is not yet virialized into halos. The general question of dark matter outside of (and between) galaxy systems is out of the scope of the present discussion which focuses on group halos. Here we just mention that the range of reported results from the Virgo infall studies and even larger scale (100–200 Mpc) local bulk flows, Ωloc ≈ 0.15 − 0.5 (Bahcall et al. 2000) do not reveal any clear underdensity; note that such studies encompass both the groups (including their halos) and the matter in between.
In the following sections we determine the theoretically possible maximum amount of dark matter around individual groups for which a virial mass estimate has been made for the interior part. A novel aspect is that we have now a natural upper limit for integrating any gravitationally bound matter density distribution around the group: the zero-gravity distance from the group. The zero-gravity distance itself, along with the total mass, can be derived when one knows the (virial) mass in an inner part of the group, the density profile, and the local dark energy density (Sect. 4).
3. Dark energy on the group scale
Following the standard ΛCDM cosmology, we assume the universal dark energy background first discovered by Riess et al. (1998) and Perlmutter et al. (1999) from observations of type Ia supernovae at horizon-size distances ~ 1000 Mpc. These and other observations (in particular the studies of the cosmic microwave background anisotropy – see Spergel et al. 2007) indicate that the global dark energy density is ΩDE = 0.73, nearly 3/4 of the total energy content of the universe. ΛCDM cosmology adopts the simplest, straightforward and quite likely interpretation, according to which dark energy is represented by Einstein’s cosmological constant Λ and its density  . If this is so, dark energy is the energy of the cosmic vacuum (Gliner 1965) and it may be described macroscopically as a perfect uniform fluid with the equation of state pDE = −ρDEc2.
3.1. Zero-gravity radius
This standard interpretation implies that all the material bodies of nature are imbedded in the uniform dark energy background. Although dark energy betrayed it existence through its effect on the universe as a whole, it acts also on groups and clusters of galaxies, so that their physics involves both matter gravity and dark energy antigravity. It is significant that antigravity may be as strong as gravity on the scales of 1–10 Mpc (Chernin et al. 2000; Chernin 2001, 2008), and in the general galaxy distribution as described by the standard correlation function, the typical gravity-dominated scale is about  Mpc (Teerikorpi et al. 2005).
Now we summarize the basics of the gravity-antigravity interplay on group and cluster scales as needed below.
Dark energy is a relativistic fluid and its description needs General Relativity. However, it may be treated in terms of Newtonian mechanics, if its force field is weak in the usually accepted sense. The Newtonian description borrows from General Relativity a major result: the effective gravitating density of a uniform medium with the density ρ and pressure p is given by the sum  (5)(The speed of light c = 1). With its equation of state pDE = −ρDE, dark energy has a negative effective gravitating density:
  (6)It is because of this negative value that dark energy produces antigravity. Einstein’s law of universal antigravity says that two bodies imbedded in the dark energy background feel mutual repulsion with the force (per the unit mass of the body) which is proportional to the density ρDE,eff and the distance r between them:
  (7)Consider a spherical mass M of non-relativistic matter embedded in the dark energy background. A test particle at the distance r from the mass center (outside the mass) experiences the radial acceleration
  (8)in the reference frame of the mass center1. It is thus seen that there is a distance at which the total force F is zero:
 ![Mathematical equation: \begin{equation} r = R_{\rm ZG} = \left[\frac{M}{{\frac{8\pi}{3}}\rho_{\rm DE}}\right]^{1/3}\cdot \end{equation}](/articles/aa/full_html/2012/03/aa17143-11/aa17143-11-eq83.png) (9)Here RZG is the zero-gravity radius (Chernin et al. 2000; Chernin 2001, 2008). The gravity dominates at distances r < RZG, while the antigravity is stronger than the gravity at r > RZG. Therefore a gravitationally bound system with the mass M can exist only within the sphere of radius RZG. Thus the zero-gravity radius is an absolute upper bound for the radial size R of a gravitationally bound halo:
(9)Here RZG is the zero-gravity radius (Chernin et al. 2000; Chernin 2001, 2008). The gravity dominates at distances r < RZG, while the antigravity is stronger than the gravity at r > RZG. Therefore a gravitationally bound system with the mass M can exist only within the sphere of radius RZG. Thus the zero-gravity radius is an absolute upper bound for the radial size R of a gravitationally bound halo: ![Mathematical equation: \begin{equation} R \le R_{\rm ZG} = \left[\frac{M}{{\frac{8\pi}{3}}\rho_{\rm DE}}\right]^{1/3} \simeq 1\times \left[\frac{M}{10^{12}~M_{\odot}}\right]\,\, {\rm~Mpc}\cdot \end{equation}](/articles/aa/full_html/2012/03/aa17143-11/aa17143-11-eq87.png) (10)Consider the Local Group of galaxies. Its matter mass M = 1012 M⊙; then Eq. (10) gives its maximal radial size: RZG = 1 Mpc. Because the observed radial size of the group is just near 1 Mpc (van den Bergh 1999; Karachentsev 2005; Karachentsev & Nasonova 2010), one may conclude that the dark halo of the Local Group has the maximal possible size, RLG = RZG, and therefore its observed mass is the maximal possible one:
(10)Consider the Local Group of galaxies. Its matter mass M = 1012 M⊙; then Eq. (10) gives its maximal radial size: RZG = 1 Mpc. Because the observed radial size of the group is just near 1 Mpc (van den Bergh 1999; Karachentsev 2005; Karachentsev & Nasonova 2010), one may conclude that the dark halo of the Local Group has the maximal possible size, RLG = RZG, and therefore its observed mass is the maximal possible one:  (Chernin et al. 2000; Baryshev et al. 2001; Chernin et al. 2007a).
The same result is obtained for two nearby groups (M 81 and Cen A) and also the Virgo cluster (Chernin et al. 2007b,c; 2010). As we see, the well-studied systems all have ~ maximally extended halos. Could it be a common feature of all groups and clusters (at least in the LU) of a spatial scale of 1–10 Mpc? This question is of key importance for our discussion here; an answer to it is yet unknown.
3.2. The dark energy term in the virial mass estimate
Chernin et al. (2009) pointed out that the classical virial mass estimate formula should be modified to take into account the contribution from the antigravitating dark energy within the galaxy group. Classical estimates generally underestimate the mass. The correction term is equal to twice the absolute value of the (anti)gravitating DE mass within the group volume. Numerically, it is 0.9 × 10¹²(R/ Mpc)3 M⊙, or 0.1 × 10¹² M⊙, 0.9 × 10¹² M⊙, and 7 × 10¹² M⊙ for R = 0.5 Mpc, R = 1 Mpc, and R = 2 Mpc, respectively. Hence we see that though the correction always increases the virial mass, it can be significant only for some non-compact low-mass groups and cannot explain the “missing mass” problem which we discuss.
4. Extended dark matter halos: upper bounds
According to Eq. (10), the mass of a halo is maximal M = Mmax, if the halo has the maximal possible size R = RZG. For (approximately) spherical halos, we now estimate Mmax as a function of their observed (inner part) parameters using two models of the density distribution in a halo.
4.1. The isothermal halo
The simplest isothermal density profile for the dark matter distribution in a halo is: 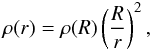 (11)
(11)
where ρ(r) is the density at the distance r from the halo center, ρ(R) is the density at the halo’s outer edge, and R = RZG is the radius of the maximally extended halo. Then the total mass M within the sphere of the radius r is 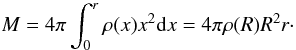 (12)
(12)
If r = R = RZG, the maximal mass 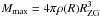 . On the other hand, as seen from Eqs. (9), (10),
  ; then Eq. (12) gives:
 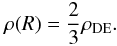 (13)The cut-off edge density ρ(R) proves to be a constant value which does not depend on the total mass of the isothermal halo; the density is equal to the universal dark energy density with an order-of-unity numerical factor (Bisnovatyi-Kogan & Chernin 2012).
It also follows from Eq. (13) that the mean halo density, ⟨ ρ ⟩ , is again given by the dark energy density, but with another numerical factor (Bisnovatyi-Kogan & Chernin 2012):  (14)This relation is obviously valid for any halo profile, not only for the isothermal one.
Consider an inner spherical part of a halo with the radius R0 < R. Its mass  . Now the total halo radius ( = RZG) may be expressed in terms of the dark energy density and the values of M0 and R0 only:
 ![Mathematical equation: \begin{equation} R = R_{\rm ZG} = \left[\frac{3}{8\pi \rho_{\rm DE}}\right] ^{1/2}\left[\frac{M_0}{R_0}\right]^{1/2}\cdot \end{equation}](/articles/aa/full_html/2012/03/aa17143-11/aa17143-11-eq118.png) (15)Then the total mass of the halo is
(15)Then the total mass of the halo is ![Mathematical equation: \begin{eqnarray} M = M_{\rm max} &=& \left[\frac{3}{8\pi \rho_{\rm DE}}\right]^{1/2}\left[\frac{M_0}{R_0}\right]^{3/2} \nonumber \\ &\quad \simeq & 1 \times 10^{12} \left[\frac{M_0}{10^{12}~M_{\odot}}\right]^{3/2} \left[\frac{R_0}{1 {\rm~Mpc}}\right]^{-3/2}\, M_{\odot}\cdot \end{eqnarray}](/articles/aa/full_html/2012/03/aa17143-11/aa17143-11-eq119.png) (16)The ratio of the mass M = Mmax to the inner mass M0 is a dimensionless quantitative measure of the matter “capacity” of the halo:
(16)The ratio of the mass M = Mmax to the inner mass M0 is a dimensionless quantitative measure of the matter “capacity” of the halo: ![Mathematical equation: \begin{equation} C \equiv \frac{M}{M_0} \simeq \left[\frac{M_0}{10^{12}~M_{\odot}}\right]^{1/2} \left[\frac{R_0}{1 {\rm~Mpc}}\right]^{-3/2}\cdot \end{equation}](/articles/aa/full_html/2012/03/aa17143-11/aa17143-11-eq120.png) (17)
(17)
4.2. The Navarro-Frenk-White halo
Consider now halos with the “universal” NFW density profile (Navarro et al. 1997):  (18)where ρu = ρ(ru). The maximal (total) halo mass is
 ![Mathematical equation: \begin{equation} M_{\rm max} = M (R_{\rm ZG}) = 16 \pi \rho_u R_{\rm ZG}^3 \beta^{-3} \left[\ln (1 + \beta) - \frac{\beta}{1 + \beta}\right], \end{equation}](/articles/aa/full_html/2012/03/aa17143-11/aa17143-11-eq123.png) (19)where
(19)where  . With the relation
  , two characteristic densities may be found from Eq. (19):
  (20)
(20)![Mathematical equation: \begin{equation} \rho(R_{ZG}) = \frac{2}{3} \frac{\rho_{\Lambda} \beta^2}{\left[\ln (1 + \beta) - \frac{\beta}{1 + \beta}\right] (1 + \beta)^2}\cdot \end{equation}](/articles/aa/full_html/2012/03/aa17143-11/aa17143-11-eq127.png) (21)The mass M0 within a sphere of the radius R0 = ru is
(21)The mass M0 within a sphere of the radius R0 = ru is ![Mathematical equation: \begin{equation} M_{0} = M (R_{0}) = 16 \pi \rho_u R_0^3 \left[\ln 2 - \frac{1}{2}\right], \end{equation}](/articles/aa/full_html/2012/03/aa17143-11/aa17143-11-eq129.png) (22)The density ρu can be expressed in terms of M0 and R0:
(22)The density ρu can be expressed in terms of M0 and R0: ![Mathematical equation: \begin{equation} \rho_u = \frac{M_0}{16 \pi R_0^3}\left[\ln 2 - \frac{1}{2}\right]^{-1}\cdot \end{equation}](/articles/aa/full_html/2012/03/aa17143-11/aa17143-11-eq131.png) (23)Now Eqs. (20) and (23) lead to the equation for β:
(23)Now Eqs. (20) and (23) lead to the equation for β: ![Mathematical equation: \begin{equation} \frac{M_0}{\frac{8\pi}{3} \rho_{\rm DE}R_0^3} \left[ \ln 2 - \frac{1}{2}\right]^{-1} = \beta^3 \left[\ln (1 + \beta) - \frac{\beta}{1 + \beta}\right]^{-1}\cdot \end{equation}](/articles/aa/full_html/2012/03/aa17143-11/aa17143-11-eq133.png) (24)This may be rewritten as
(24)This may be rewritten as ![Mathematical equation: \begin{equation} 6.4 \frac{\frac{M_0}{10^{12}\,M_{\odot}}}{\left[\frac{R_0}{1 {\rm~Mpc}}\right]^3} = \beta^3 \left[ \ln (1 + \beta) - \frac{\beta}{1 + \beta}\right]^{-1}\cdot \end{equation}](/articles/aa/full_html/2012/03/aa17143-11/aa17143-11-eq134.png) (25)We may also rewrite Eq. (10) in the form
(25)We may also rewrite Eq. (10) in the form  (26)Then Eqs. (25) and (26) give Mmax expressed in terms of M0 and R0. We have also capacity C via the parameter β only:
  (27)
(27)
4.3. Estimates
A tentative estimate of the capacity C may be obtained using the median values of sizes and masses from the LDC, HDC and MK Catalogues (Sect. 2). Such an estimate assumes that a “typical” group has an inner part with the size R0 and the mass M0 as inferred from luminous matter observations. The group is typical in the sense that its inner size R0 and mass M0 are identical to the median size and mass, correspondingly, given by the catalogue data. In order to transform the projected virial radius into the intrinsic radius, to be identified with R0, we multiply it by the usual projection factor π/2 = 1.57 (e.g., Heisler et al. 1985).
4.3.1. The isothermal model
Consider first the isothermal model. The data of Sect. 2 lead to C = 1.9 and C = 2.5 for the virial and projective masses, respectively, of the LDC Catalogue. With the HDC Catalogue, C = 3.4 and C = 4.0 for the virial and projective masses, respectively. C = 5.6 and C = 6.6 for the virial and projective masses, respectively, of the MK Catalogue.
The upper bounds for the mass of an extended halo follow from the capacity C. With the data of Sect. 2 and the estimates above, we find: Mmax ≃ (1.2−8) × 1014 M⊙ and Mmax ≃ (1.1−4.0) × 1014 M⊙ for the LDC and HDC Catalogues, respectively. The upper mass bound for the MK Catalogue is Mmax ≃ (1.3−2.2) × 1013 M⊙. For all the three catalogues, the mass upper bound proves to be in a wide interval from 1.3 × 10¹³ to 0.8 × 10¹⁵ M⊙. The values in the interval are closer to the masses of clusters rather than ordinary groups of galaxies.
With these masses, the interval of the upper bounds on the sizes of halos become: RZG = 2.6−10 Mpc. These values are also more typical to clusters rather than groups.
4.3.2. The NFW model
Similar results follow from the NFW model. Indeed, with the data of Sect. 2 we find: C = 3.3 and C = 3.6 for the virial and projective masses (with β = 3.0 and 3.3, respectively, of the LDC Catalogue). With the HDC Catalogue, C = 4.4 and C = 4.7 for the virial and projective masses (with β = 4.3 and 4.7, respectively). We find also C = 5.5 and C = 5.8 for the virial and projective masses (with β = 5.8 and 6.3, respectively, of the MK Catalogue).
The maximal masses (virial and projective ones) come from the capacity C with the data of Sect. 2: Mmax = 2.2 and 3.9 × 10¹⁴ M⊙ for the LDC; Mmax = 1.4 and 2.1 × 10¹⁴ M⊙ for the HDC Catalogue. The upper mass bounds for the MK Catalogue are Mmax = 1.3 and 1.9 × 10¹³ M⊙. For all the three catalogues, the mass upper bounds lie practically in the same interval as the one found above from the isothermal model.
Strictly speaking, these values correspond to fitting the NFW model using ru = R0, while actually one may expect that ru < R0, depending on the sample and the individual group. Denote R0 = αru. For instance, with α = 9, 4.5, and 1.5 for the LCD, the HDC, and the MK samples, respectively, the derived values of C decrease by factors of 1.5 to 2, resulting in the average of Ωloc ≈ 0.3. Because the real halo profiles are not known (and may deviate from those obtained in cosmological numerical simulations, e.g., Fukushige & Makino 2003), the profiles used here are intended to illustrate the expected effect, rather than give accurate predictions.
Similar results come also from the Einasto density profile (Einasto & Haud 1989) with a reasonable choice of the free parameters of the profiles.
5. Conclusions
Now we may use our results above to estimate the upper bound of the density of the local dark matter. This may be tentatively evaluated with the relation Ωmax = CΩloc, where Ωloc is the observed median value. Then Ωmax ≃ 0.3−0.8 ≃ (1−3)Ωm (with one-digit accuracy) for the HDC, LDC and MK Catalogues and the models described above. Finally, we have for the “real” local mean matter density of the Local Universe:  (28)One may conclude that maximally extended dark halos of galaxy groups are able to contain enough mass to fill or even overfill the gap between the lowest observed density and the mean cosmic matter density. The right-hand side of Eq. (28) corresponds to the density contrast
  (29)Hence, the LU may be representative of the cosmic density or, depending on the true halo density profiles, it may even be a weak overdensity with the density contrast about δ ~ 1 in the general cosmic matter distribution.
To summarize,
-
1.
The local mean matter (dark andbaryonic) density is estimated to beΩloc = 0.08 − 0.23 from recent data on groups of galaxies located at distances up to 50–150 Mpc from us, apparently less than the cosmological mean density Ωm = 0.27. However, such Ωloc takes into account only the inner visible parts of galaxy groups. The outer layers of halos are usually devoid of bright galaxies and cannot be seen at large distances. How much of mass may be hidden in the outer invisible parts of the group halos?
-
2.
The key physical factor which bounds the size and mass of an isolated halo is the local antigravity produced by the omnipresent background of dark energy. A gravitationally bound halo does not extend beyond the zero-gravity surface at which the gravity of matter and the antigravity of dark energy balance. We have used our theory of the local dynamical effects of dark energy to estimate the maximal possible sizes and masses of the extended dark halos.
-
3.
From the data of three recent catalogs of galaxy groups, we have shown that the calculated mass limits conform with the assumption that a significant amount of unaccounted dark matter is located in the invisible outer parts of the extended halos. Depending on the real halo density profiles, the total mass of an extended halo may be a few times the mass of its visible interior, which is enough to make Ωloc ≥ Ωm.
-
4.
The Local Group and two other nearby groups of galaxies, as well as the Virgo cluster have dark halos which seem to extend up to their zero-gravity surfaces and have maximal possible masses. If the maximally extended halo is a common feature of the gravitationally bound systems on the scale of galaxy groups and clusters, the calculations allow that the LU of 100–300 Mpc across could even be a weak overdensity, rather than underdensity, with a density contrast ~ 1.
Acknowledgments
We thank Yu. N. Efremov, A. V. Zasov, I. D. Karachentsev and D. I. Makarov for many useful discussions. A.C., V.D., and L.D. appreciate a partial support from the RFBR grant 02-10-00178. We also thank the referee for useful comments.
References
- Abate, A., & Erdogdu, P. 2009, MNRAS, 400, 1541 [NASA ADS] [CrossRef] [Google Scholar]
- Bahcall, J. N., & Tremaine, S. 1981, ApJ, 244, 805 [NASA ADS] [CrossRef] [Google Scholar]
- Bahcall, N. A., Cen, R., Dave, R., Ostriker, J. P., & Yu, Q. 2000, ApJ, 541, 1 [NASA ADS] [CrossRef] [Google Scholar]
- Balaguera-Antolinez, A., Mota, D. F., & Nowakowski, M. 2007, MNRAS, 382, 621 [NASA ADS] [CrossRef] [Google Scholar]
- Baryshev, Yu. V., Chernin, A. D., & Teerikorpi, P. 2001, A&A, 378, 729 [NASA ADS] [CrossRef] [EDP Sciences] [Google Scholar]
- Bisnovatyi-Kogan, G. S., & Chernin, A. D. 2012, Ap&SS, in press [Google Scholar]
- Böhmer, C. G., & Fodor, G. 2008, Phys. Rev. D, 77, 4008 [Google Scholar]
- Byrd, G. G., Chernin, A. D., & Valtonen, M. J. 2007, Cosmology: Foundations and Frontiers Moscow, URSS [Google Scholar]
- Chernin, A. D. 2001, Physics-Uspekhi, 44, 1099 [NASA ADS] [CrossRef] [Google Scholar]
- Chernin, A. D. 2008, Physics-Uspekhi, 51, 267 [Google Scholar]
- Chernin, A. D., Teerikorpi, P., & Baryshev, Yu. V. 2000, Adv. Space Res., 31, 459, 2003 [NASA ADS] [CrossRef] [Google Scholar]
- Chernin, A.D., Teerikorpi, P., & Baryshev, Yu. V. 2006, A&A, 456, 13 [Google Scholar]
- Chernin, A. D., Karachentsev, I. D., Kashibadze, O. G., et al. 2007a, Astrophys., 50, 405 [NASA ADS] [CrossRef] [Google Scholar]
- Chernin, A. D., Karachentsev, I. D., Makarov, D. I., et al. 2007b, A&AT, 26, 275 [NASA ADS] [Google Scholar]
- Chernin, A. D., Karachentsev, I. D., Valtonen, M. J., et al. 2007c, A&A, 467, 933 [NASA ADS] [CrossRef] [EDP Sciences] [Google Scholar]
- Chernin, A. D., Teerikorpi, P., Valtonen, M. J., et al. 2009, A&A, 507, 1271 [NASA ADS] [CrossRef] [EDP Sciences] [Google Scholar]
- Chernin, A. D., Karachentsev, I. D., Nasonova, O. G., et al. 2010, A&A, 520, A104 [NASA ADS] [CrossRef] [EDP Sciences] [Google Scholar]
- Courtois, H., Paturel, G., Sousbie, T., & Sylos Labini, F. 2004, A&A, 423, 27 [NASA ADS] [CrossRef] [EDP Sciences] [Google Scholar]
- Crook, A. D., Huchra, J. P., Martimbeau, N., et al. 2007, ApJ, 655, 790 (Erratum 2008, ApJ, 685, 1320) [NASA ADS] [CrossRef] [Google Scholar]
- Einasto, J., & Haud, U. 1989, A&A, 223, 89 [NASA ADS] [Google Scholar]
- Fukushige, T., & Makino, J. 2003, ApJ, 588, 674 [NASA ADS] [CrossRef] [Google Scholar]
- Gliner, E. B. 1965, JETP, 49, 542 [Google Scholar]
- Gliner, E. B. 1966, Sov. Phys. JETP, 22, 376 [NASA ADS] [Google Scholar]
- Hartwick, F. D. A. 2011, AJ, 141, 198 [NASA ADS] [CrossRef] [Google Scholar]
- Heisler, J., Tremaine, S., Bahcall, J. N. 1985, ApJ, 298, 8 [NASA ADS] [CrossRef] [Google Scholar]
- Iorio, L. 2006, Int. J. Mod. Phys., D15, 473 [NASA ADS] [Google Scholar]
- Karachentsev, I. D. 2005, AJ, 129, 178 [NASA ADS] [CrossRef] [Google Scholar]
- Karachentsev, I. D., & Nasonova, O. G. 2010, MNRAS, 405, 1075 [NASA ADS] [Google Scholar]
- Karachentsev, I. D., Chernin, A. D., & Teerikorpi, P. 2003, Astrophys., 46, 491 [Google Scholar]
- Karachentsev, I. D., Kashibadze, O. G., Makarov, D. I., & Tully, R. B. 2009, MNRAS, 393, 1265 [NASA ADS] [CrossRef] [Google Scholar]
- Magtesyan, A. P. 1988, Astrophys., 28, 150 [NASA ADS] [CrossRef] [Google Scholar]
- Manera, M., Mota, D. F. 2006, MNRAS, 371, 1373 [NASA ADS] [CrossRef] [Google Scholar]
- Makarov, D. I., & Karachentsev, I. D. 2011, MNRAS, 412, 2498 [NASA ADS] [CrossRef] [Google Scholar]
- Mota, D. F. 2008, JCAP, 9, 6 [Google Scholar]
- Navarro, J. F., Frenk, C. S., & White, S. D. M. 1997, ApJ, 490, 493 [NASA ADS] [CrossRef] [Google Scholar]
- Nowakowski, M. 2001, IJMPD, 10, 649 [Google Scholar]
- Nowakowski, M., Sanabria, J.-C., & Garcia, A. 2002, Phys. Rev. D, 66, 3003 [Google Scholar]
- Nunes, N. J., & Mota, D. F. 2006, MNRAS, 368, 751 [NASA ADS] [CrossRef] [Google Scholar]
- Paturel, G., Bottinelli, L., Gouguenheim, L., & Fouqué, P. 1988, A&A, 189, 1 [NASA ADS] [Google Scholar]
- Peirani, S., & de Freitas Pacheco, J. A. 2006, New Astron., 11, 325 [Google Scholar]
- Peirani, S., & de Freitas Pacheco, J. A. 2008, A&A, 488, 845 [NASA ADS] [CrossRef] [EDP Sciences] [Google Scholar]
- Perlmutter, S., Aldering, G., Goldhaber, G., et al. 1999, ApJ, 517, 565 [NASA ADS] [CrossRef] [Google Scholar]
- Riess, A. G., Filippenko, A. V., Challis, P., et al. 1998, AJ, 116, 1009 [NASA ADS] [CrossRef] [Google Scholar]
- Rines, K., & Diaferio, A. 2006, AJ, 132, 1275 [NASA ADS] [CrossRef] [Google Scholar]
- Spergel, D. N., Bean, R., Dore, O., et al. 2007, ApJS, 170, 377 [NASA ADS] [CrossRef] [Google Scholar]
- Teerikorpi, P. 2004, A&A, 424, 73 [NASA ADS] [CrossRef] [EDP Sciences] [Google Scholar]
- Teerikorpi, P., Hanski, M., Theureau, G., et al. 1998, A&A, 334, 395 [NASA ADS] [Google Scholar]
- Teerikorpi, P., Chernin, A., & Baryshev, Yu. 2005, A&A, 440, 791 [NASA ADS] [CrossRef] [EDP Sciences] [Google Scholar]
- Teerikorpi, P., Chernin, A. D., Karachentsev, I. D., & Valtonen, M. J. 2008, A&A, 483, 383 [NASA ADS] [CrossRef] [EDP Sciences] [Google Scholar]
- Tully, B. R. 1987, ApJ, 321, 280 [NASA ADS] [CrossRef] [Google Scholar]
- van den Bergh, S. 1999, A&ARv, 9, 273 [NASA ADS] [CrossRef] [Google Scholar]
- Vennik, J. 1984, Tartu Astrofiisika Observatoorium Teated, 73, 1 [NASA ADS] [Google Scholar]
Current usage metrics show cumulative count of Article Views (full-text article views including HTML views, PDF and ePub downloads, according to the available data) and Abstracts Views on Vision4Press platform.
Data correspond to usage on the plateform after 2015. The current usage metrics is available 48-96 hours after online publication and is updated daily on week days.
Initial download of the metrics may take a while.