Fig. 6
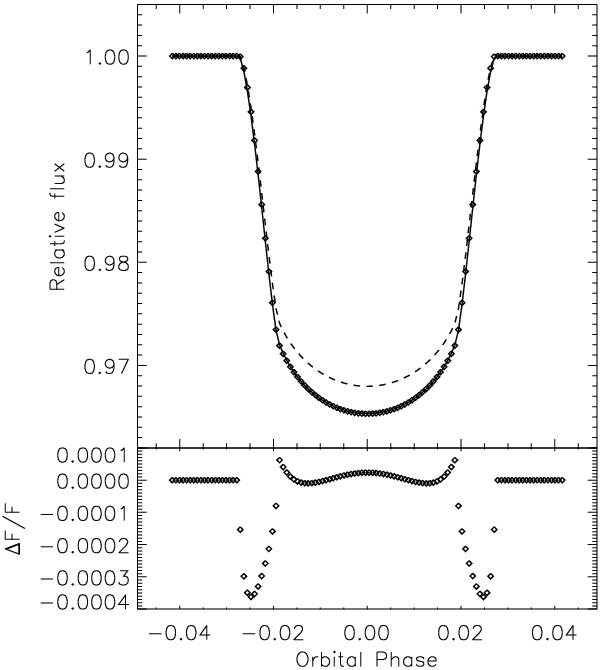
Top panel: the synthetic light curve of the transit of CoRoT-2 computed with the parameters in Table 1 of Alonso et al. (2008) (dashed line) together with the unperturbed profile obtained from Eq. (8) (diamonds) and the corresponding best fit (solid line). The flux is measured in units of the out-of-transit flux level in all the cases. Bottom panel: the residuals of the best fit to the unperturbed transit profile in relative flux units vs. the orbital phase.
Current usage metrics show cumulative count of Article Views (full-text article views including HTML views, PDF and ePub downloads, according to the available data) and Abstracts Views on Vision4Press platform.
Data correspond to usage on the plateform after 2015. The current usage metrics is available 48-96 hours after online publication and is updated daily on week days.
Initial download of the metrics may take a while.