Fig. 4
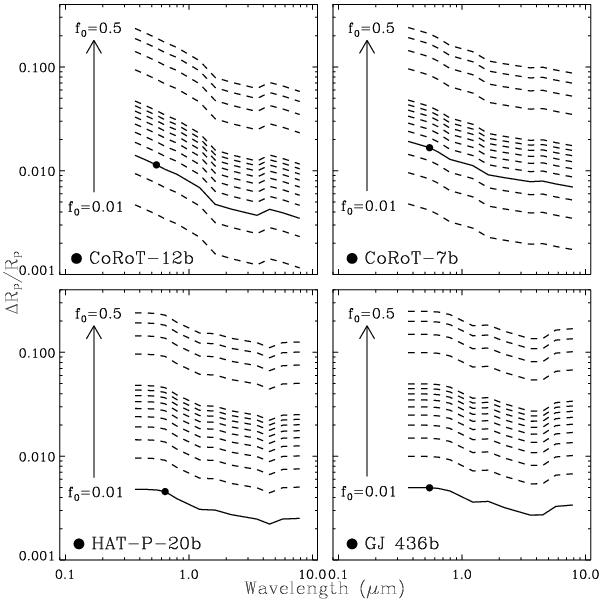
Relative variation in the apparent planetary radius vs. wavelength for all the examined planetary systems. In the top left, we present the results for CoRoT-12b, in the top right for CoRoT-7b, in the bottom left for HAT-P-20b, and in the bottom right for GJ 436b, assuming various levels of activity. The dashed curves, from the bottom to the top, correspond to increasing filling factor values, as indicated on the left of each plot. The solid curves refer to the activity levels as actually estimated for the specified systems. The filled points indicate the position of the observed planets, as described in the text.
Current usage metrics show cumulative count of Article Views (full-text article views including HTML views, PDF and ePub downloads, according to the available data) and Abstracts Views on Vision4Press platform.
Data correspond to usage on the plateform after 2015. The current usage metrics is available 48-96 hours after online publication and is updated daily on week days.
Initial download of the metrics may take a while.