Fig. 8
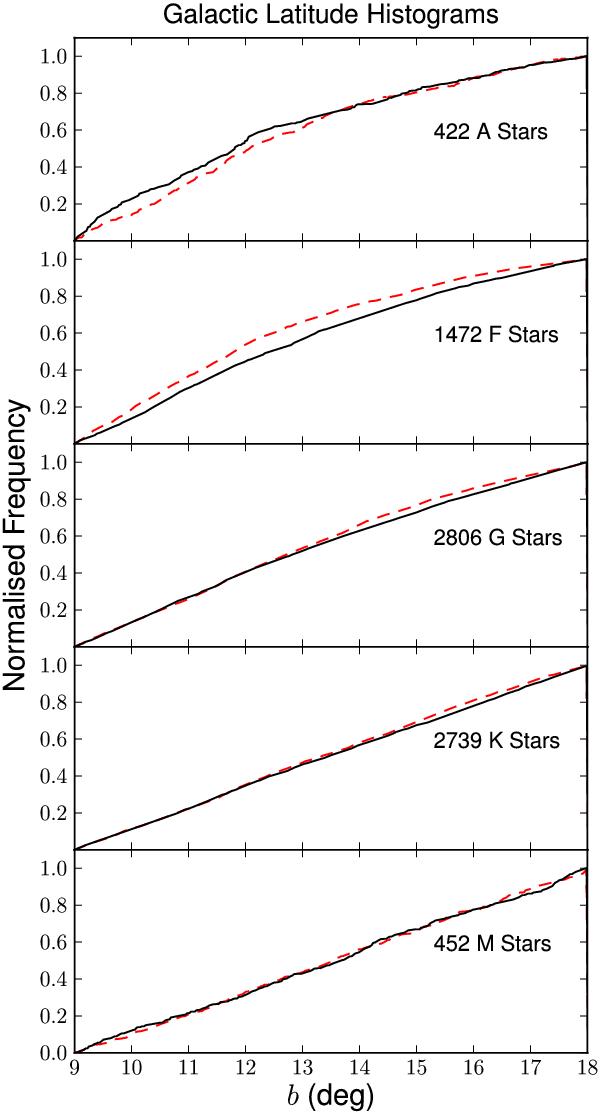
Histogram showing the galactic latitude distribution of low (solid line) and high (dashed line) variability stars for each spectral type. Sample selection ensured the orientation of the Kepler field on the plane did not introduce biases. An equal sample of high and low variability stars from each magnitude bin was also selected. The increased number of high variability F stars at low galactic latitudes may arise from giant contamination of the sample (see Sect. 3.3).
Current usage metrics show cumulative count of Article Views (full-text article views including HTML views, PDF and ePub downloads, according to the available data) and Abstracts Views on Vision4Press platform.
Data correspond to usage on the plateform after 2015. The current usage metrics is available 48-96 hours after online publication and is updated daily on week days.
Initial download of the metrics may take a while.