Fig. 5
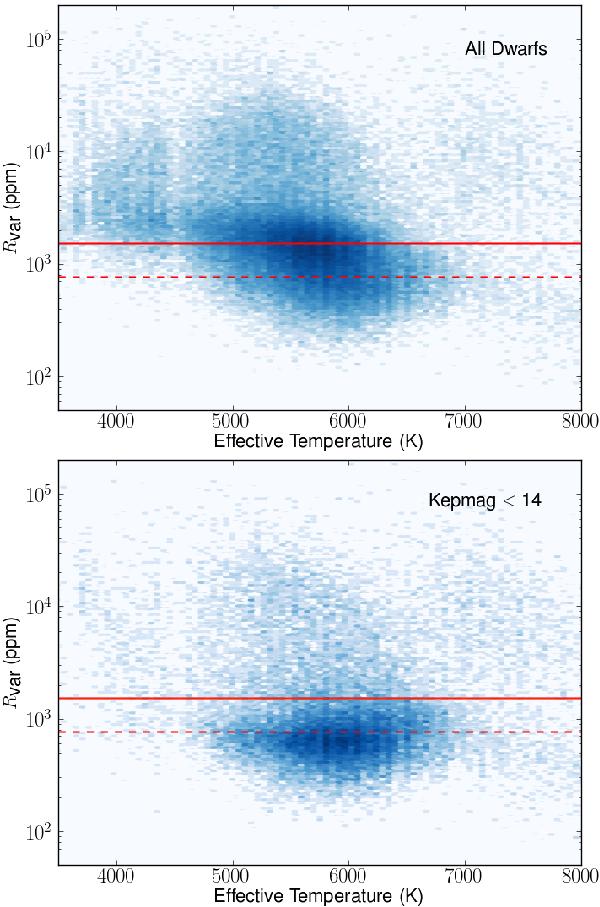
Density plot of effective temperature against Rvar, showing the decrease in variability with increasing temperature for all the selected dwarf stars (top) and for those with Kepler magnitude < 14 (bottom). This illustrates that the dearth of low variability starts at low temperatures is not a result of the increased noise floor of the cool, faint stars. The dashed line shows the solar variability level and the solid red line is twice the solar level.
Current usage metrics show cumulative count of Article Views (full-text article views including HTML views, PDF and ePub downloads, according to the available data) and Abstracts Views on Vision4Press platform.
Data correspond to usage on the plateform after 2015. The current usage metrics is available 48-96 hours after online publication and is updated daily on week days.
Initial download of the metrics may take a while.