Fig. 14
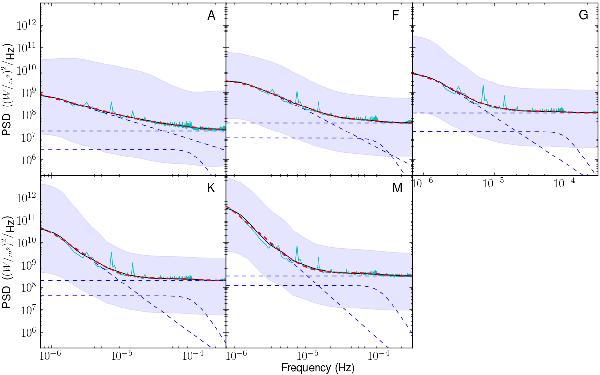
Harvey model fits to the median periodogram for each spectral type. The blue shaded area represents the region between 10–90th percentiles of variability. The cyan line shows the unsmoothed median spectrum, and the fit (red dashed line) is made to the smoothed spectra (black line). The individual components of the fit are shown as blue dashed lines (see text for full explanation).
Current usage metrics show cumulative count of Article Views (full-text article views including HTML views, PDF and ePub downloads, according to the available data) and Abstracts Views on Vision4Press platform.
Data correspond to usage on the plateform after 2015. The current usage metrics is available 48-96 hours after online publication and is updated daily on week days.
Initial download of the metrics may take a while.