Fig. 1
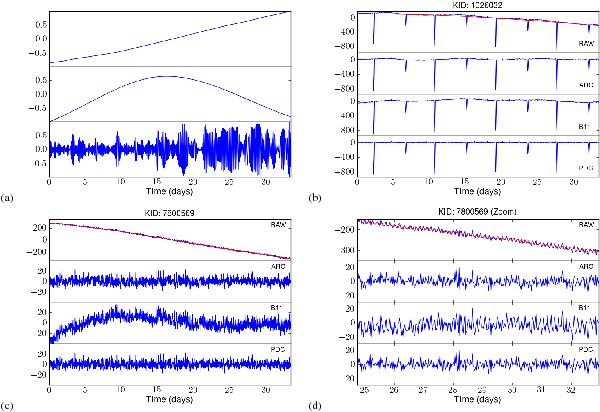
Subplot a) shows example basis trends, inferred from all Q1 data; note that the y-axis is in arbitrary units, as these basis functions are scaled to support light curves. Subplots b) and c) show examples of de-trending and allow comparison between methods: the top trace of each example shows the raw light curve (blue) and the removed trend (red) and the lower subplots show the resultant de-trended light curves using the different correction methods. Subplot d) provides detail of a small section of data, highlighting the effective satellite vibration artefact removal obtained.
Current usage metrics show cumulative count of Article Views (full-text article views including HTML views, PDF and ePub downloads, according to the available data) and Abstracts Views on Vision4Press platform.
Data correspond to usage on the plateform after 2015. The current usage metrics is available 48-96 hours after online publication and is updated daily on week days.
Initial download of the metrics may take a while.