Fig. 8
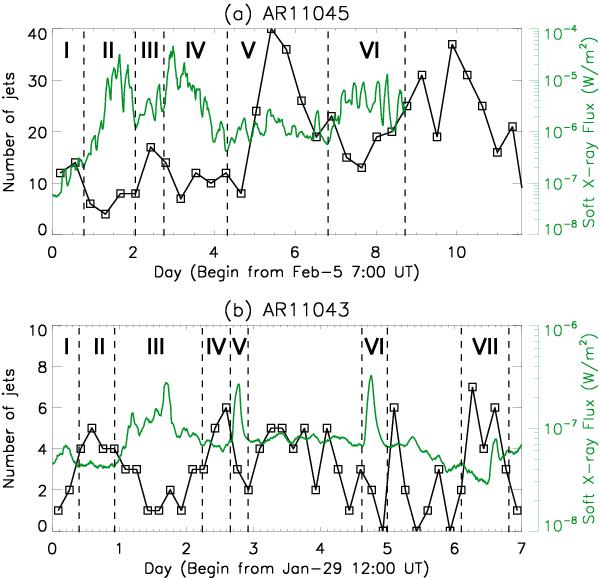
a) Time series of the GOES-14 1–8 Å soft X-ray flux (the green curve) and the number (the square signs) of the jets in 9 h in AR 11045. b) Same as a) but for the number (the square signs) of the jets in 4 h in AR 11045. The vertical dashed lines separate six regions I–VI in a) and seven regions (I–VII) in b) showing the time intervals we chose to study.
Current usage metrics show cumulative count of Article Views (full-text article views including HTML views, PDF and ePub downloads, according to the available data) and Abstracts Views on Vision4Press platform.
Data correspond to usage on the plateform after 2015. The current usage metrics is available 48-96 hours after online publication and is updated daily on week days.
Initial download of the metrics may take a while.