Fig. 5
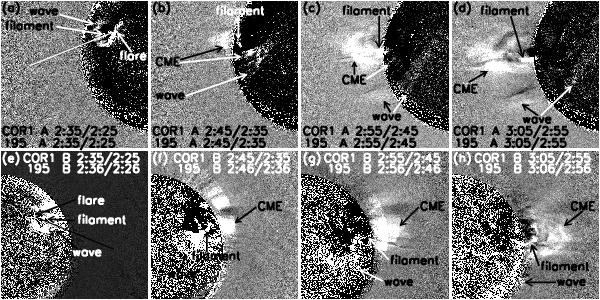
Composites of EUVI 195 Å and COR1 white light running difference images illustrating the evolutions of the flare, the filament eruption, the EUV wave and the CME. The upper panels are the STEREO-A observations, the lower panels the STEREO-B data. The white line in a) and the black line in e) present the eruption directions of the filament observed by STEREO A and B satellites, respectively. The FOV is 2.8 R⊙ × 2.8 R⊙.
Current usage metrics show cumulative count of Article Views (full-text article views including HTML views, PDF and ePub downloads, according to the available data) and Abstracts Views on Vision4Press platform.
Data correspond to usage on the plateform after 2015. The current usage metrics is available 48-96 hours after online publication and is updated daily on week days.
Initial download of the metrics may take a while.