Fig. 4
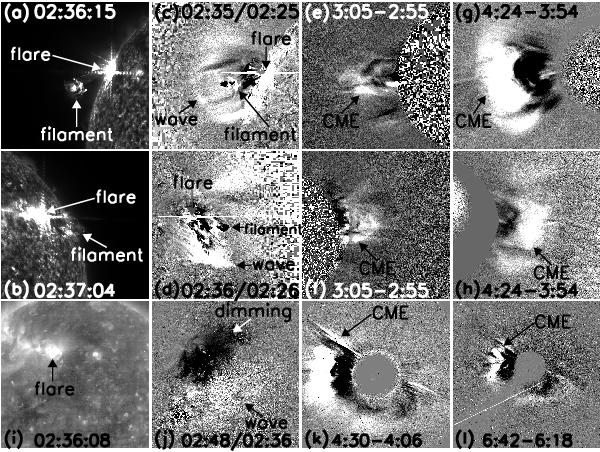
STEREO/EUVI 304 Å a) and b) and EIT 195 Å i) images illustrating a flare and a filament eruption, EUVI 195 Å c) and d) and EIT 195 Å j) running ratio images, showing an EUV wave, and COR1 e) and f), COR2 g) and h), LASCO C2 k) and C3 l) running difference images, displaying a CME, on February 7, 2010. The upper panels are observations by the STEREO A satellite, the middle panels those by the STEREO B satellite, and the lower panels those by the SOHO satellite. The FOVs are 800′′ × 800′′ in a)–d), 3.1 R⊙ × 3.1 R⊙ in e) and f), 7.7 R⊙ × 7.7 R⊙ in g) and h), 1.4 R⊙ × 1.4 R⊙ in i) and j), 12.7 R⊙ × 12.7 R⊙ in k), and 35 R⊙ × 35 R⊙ in l), respectively.
Current usage metrics show cumulative count of Article Views (full-text article views including HTML views, PDF and ePub downloads, according to the available data) and Abstracts Views on Vision4Press platform.
Data correspond to usage on the plateform after 2015. The current usage metrics is available 48-96 hours after online publication and is updated daily on week days.
Initial download of the metrics may take a while.