Fig. 3
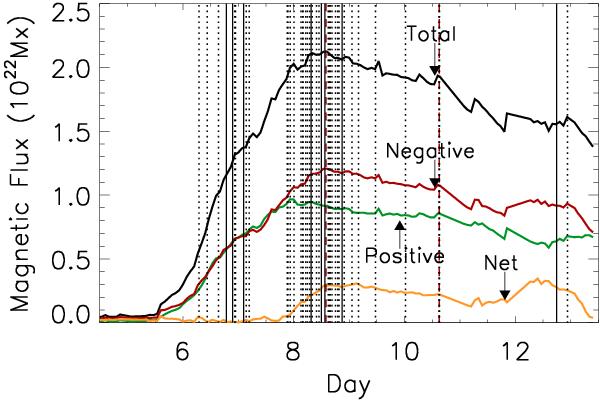
Absolute values of the total unsigned (black), positive (green), negative (red) and net (yellow) magnetic fluxes of AR 11045. The vertical dotted lines represent the beginning times of the 35 C-class flares, and the vertical solid lines the beginning times of the 8 M-class flares. The red vertical dashed lines are the two times that separate the three different phases of the magnetic flux.
Current usage metrics show cumulative count of Article Views (full-text article views including HTML views, PDF and ePub downloads, according to the available data) and Abstracts Views on Vision4Press platform.
Data correspond to usage on the plateform after 2015. The current usage metrics is available 48-96 hours after online publication and is updated daily on week days.
Initial download of the metrics may take a while.