Free Access
Fig. 3
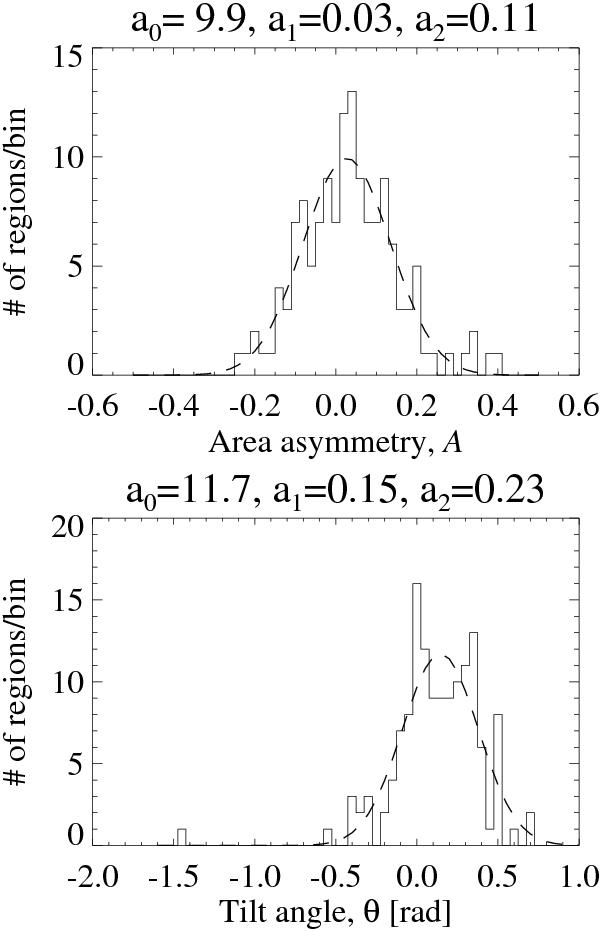
Histograms of area asymmetry (A) and tilt angle (θ). Bin sizes are 0.02 in the upper panel and 0.05 in the lower. Dashed lines show results of the Gaussian fitting. a0–a2 at the top of the both panels are the height, the center, and the width (the standard deviation) of the Gaussian distribution.
This figure is made of several images, please see below:
Current usage metrics show cumulative count of Article Views (full-text article views including HTML views, PDF and ePub downloads, according to the available data) and Abstracts Views on Vision4Press platform.
Data correspond to usage on the plateform after 2015. The current usage metrics is available 48-96 hours after online publication and is updated daily on week days.
Initial download of the metrics may take a while.